In enterprise application, performance is major requirement of success. Especially for applications where slowness will have a direct detrimental impact on business productivity, profits and even the brand itself, like trading platforms and e-commerces.
If a trading platform loads slowly or experiences errors, it will translate into loss of business, and losses can be extremely high, and the customer might end up switching to another competitor.
In this context comes the Application Performance Management (APM). APM is the monitoring and management of performance and availability of applications. APM strives to detect and diagnose complex application performance problems to maintain an expected level of service.
On this article, I am going to explain how to use Azure Monitor which is the Microsoft Azure’s product that helps you maximize performance and availability of your applications and proactively identify problems in seconds.
What’s Azure Monitor ?
Azure Monitor maximizes the availability and performance of your applications and services by delivering a comprehensive solution for collecting, analyzing, and acting on telemetry from your cloud and on-premises environments. It helps you understand how your applications are performing and proactively identifies issues affecting them and the resources they depend on.
How Azure Monitor works
Azure Monitor collects monitoring telemetry from a variety of on-premises and Azure sources. Management tools, such as those in Azure Security Center and Azure Automation, also push log data to Azure Monitor. The service aggregates and stores this telemetry in a log data store that’s optimized for cost and performance. Analyze data, set up alerts, get end-to-end views of your applications, and use machine learning–driven insights to quickly identify and resolve problems.
In this tutorial we will be covering :
- Azure Application Insights: monitors your running web app. It tells you about failures and performance issues, and helps you analyze how customers use your app.
- Azure Monitor Log: set of useful tools for performing complex analysis across Log Data from a variety of sources.
PREPARING THE SAMPLE PROJECT
The sample project for this tutorial is generated using the Spring Initializr and add these Dependencies :
- Web
- Actuator
- DevTools
You can download the sample project that I generated from here.
To this project, we need to add this Java class:
| |
Now, we will need to play with Azure Application Insights 😁😁
Enabling the Azure Application Insights
We need to start by creating a new Resource Group:
- name: azure-monitor-rg
- region: (Europe) France Central
Next, go to Monitor and click on the Applications in the Insights section:
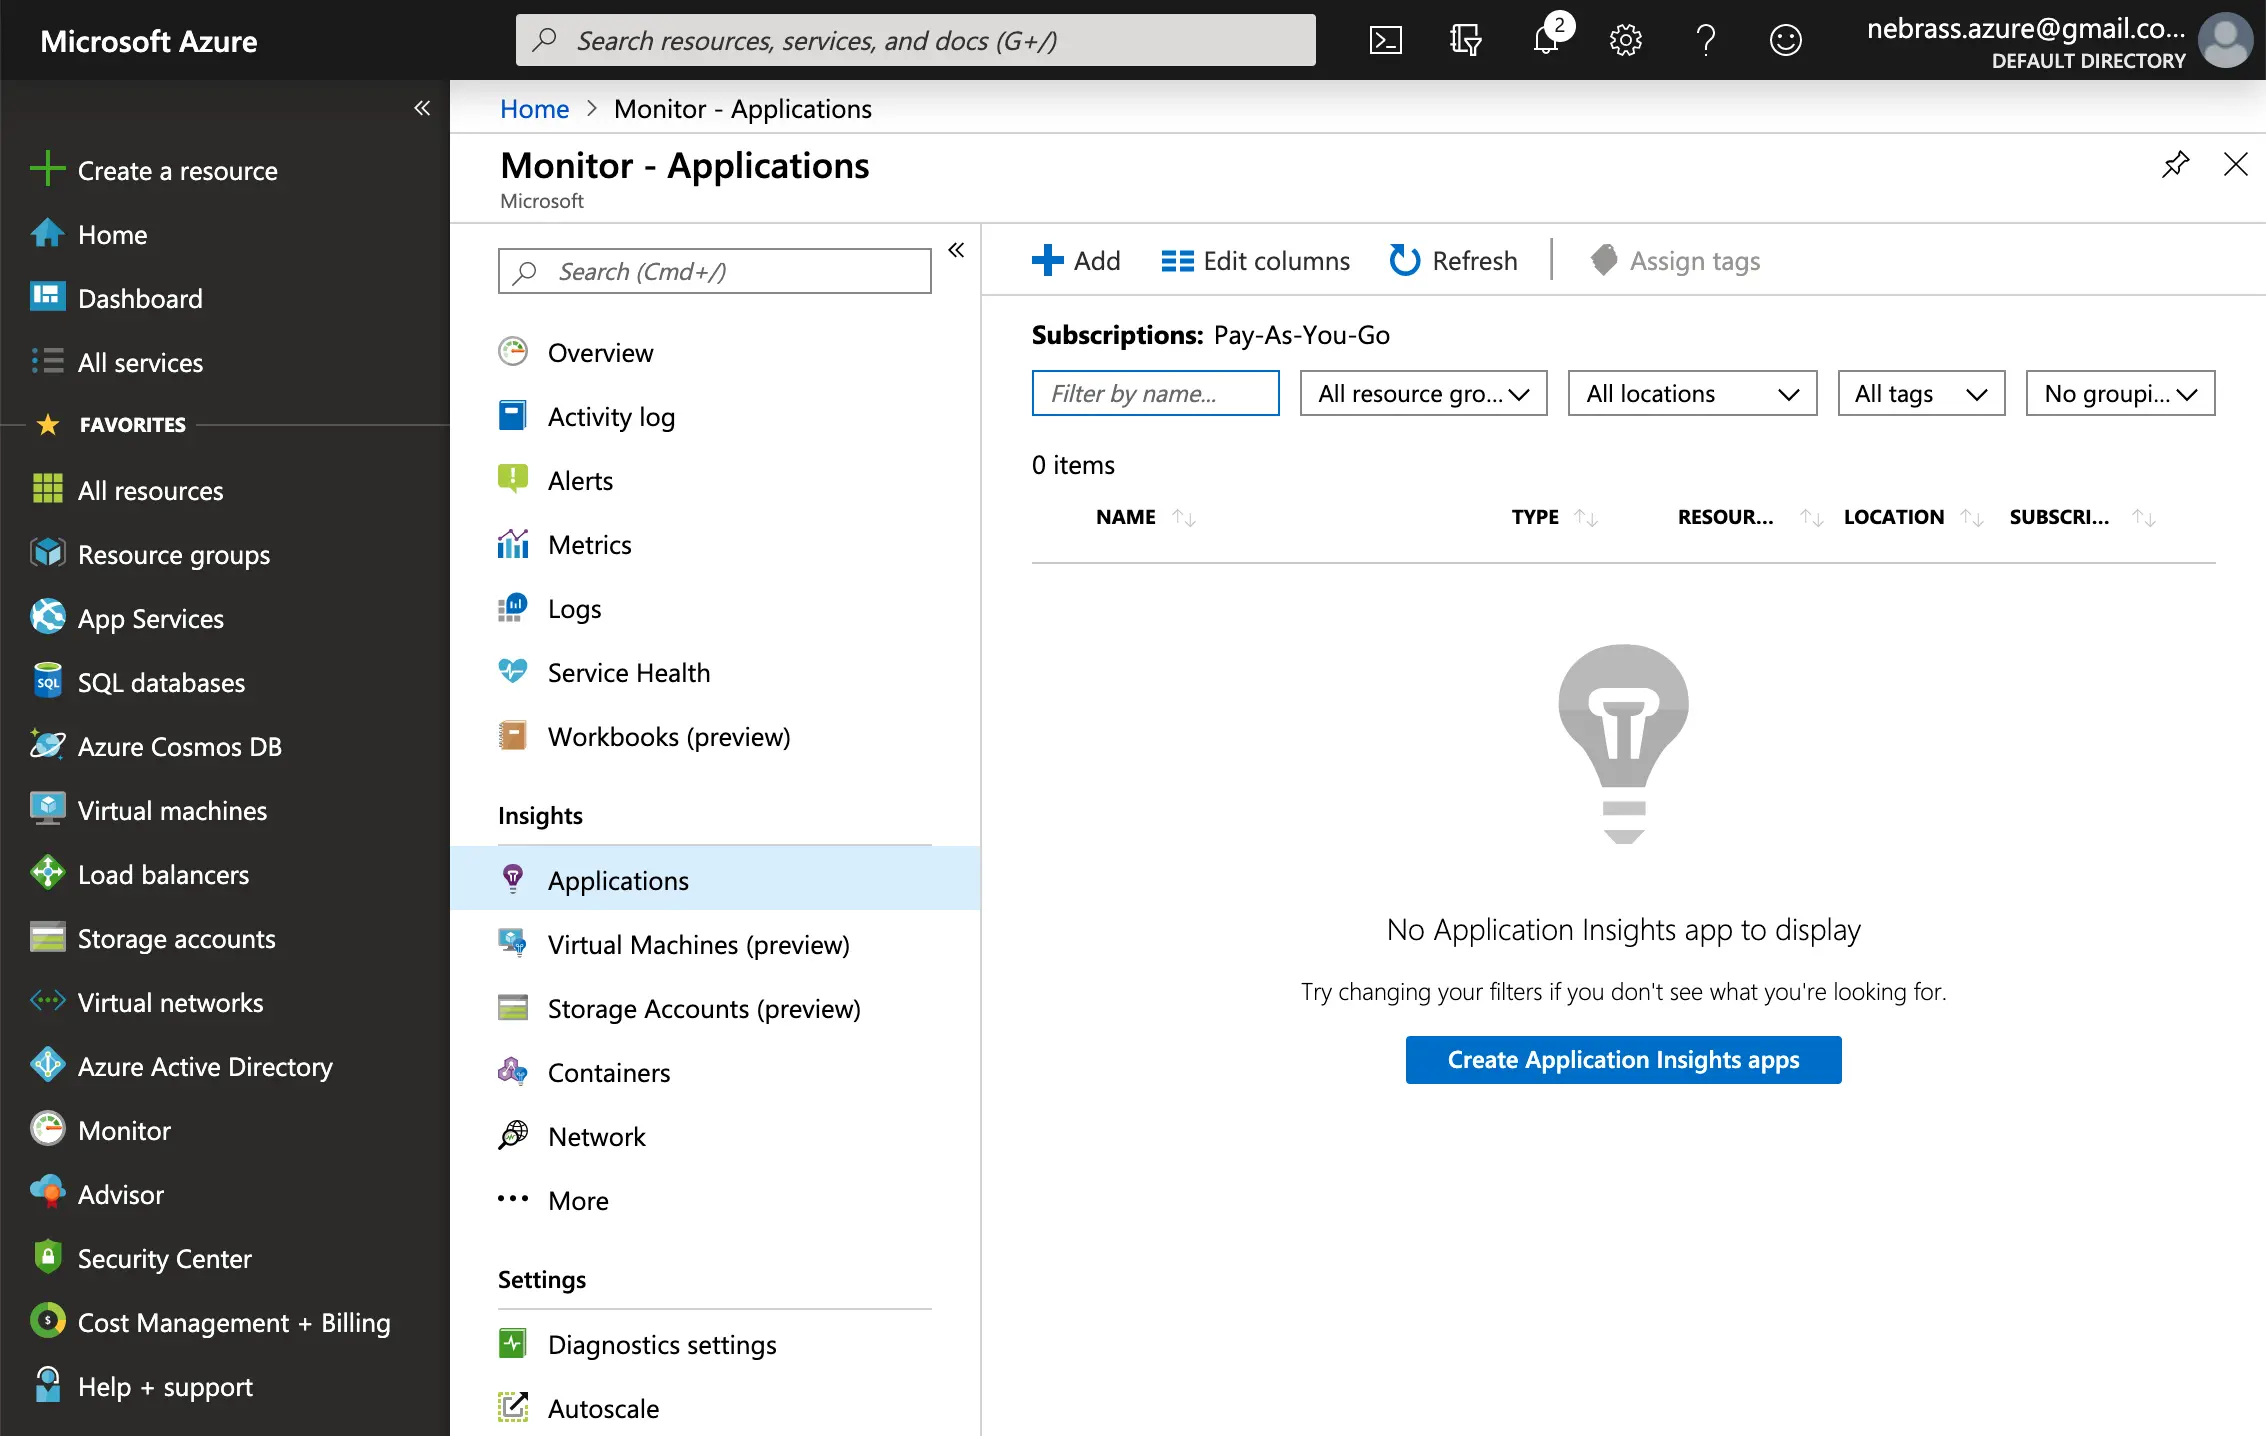
On this screen, click on Create Application Insights apps:
- name: app-insights-demo
- region: (Europe) France Central
The deployment will start:
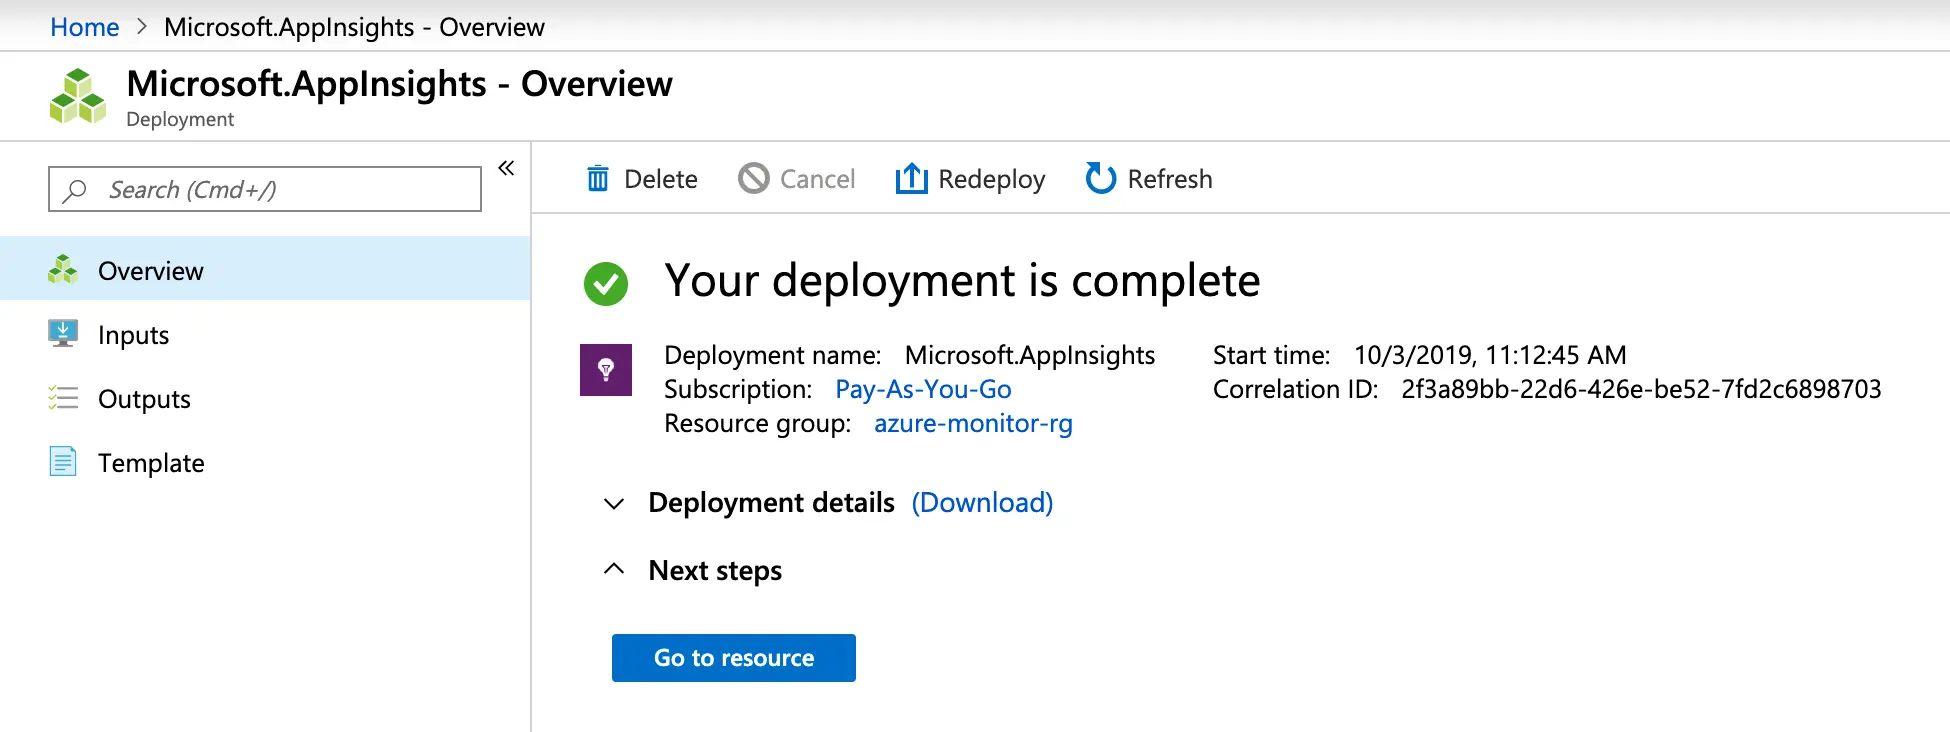
When finished click on Go to resource:
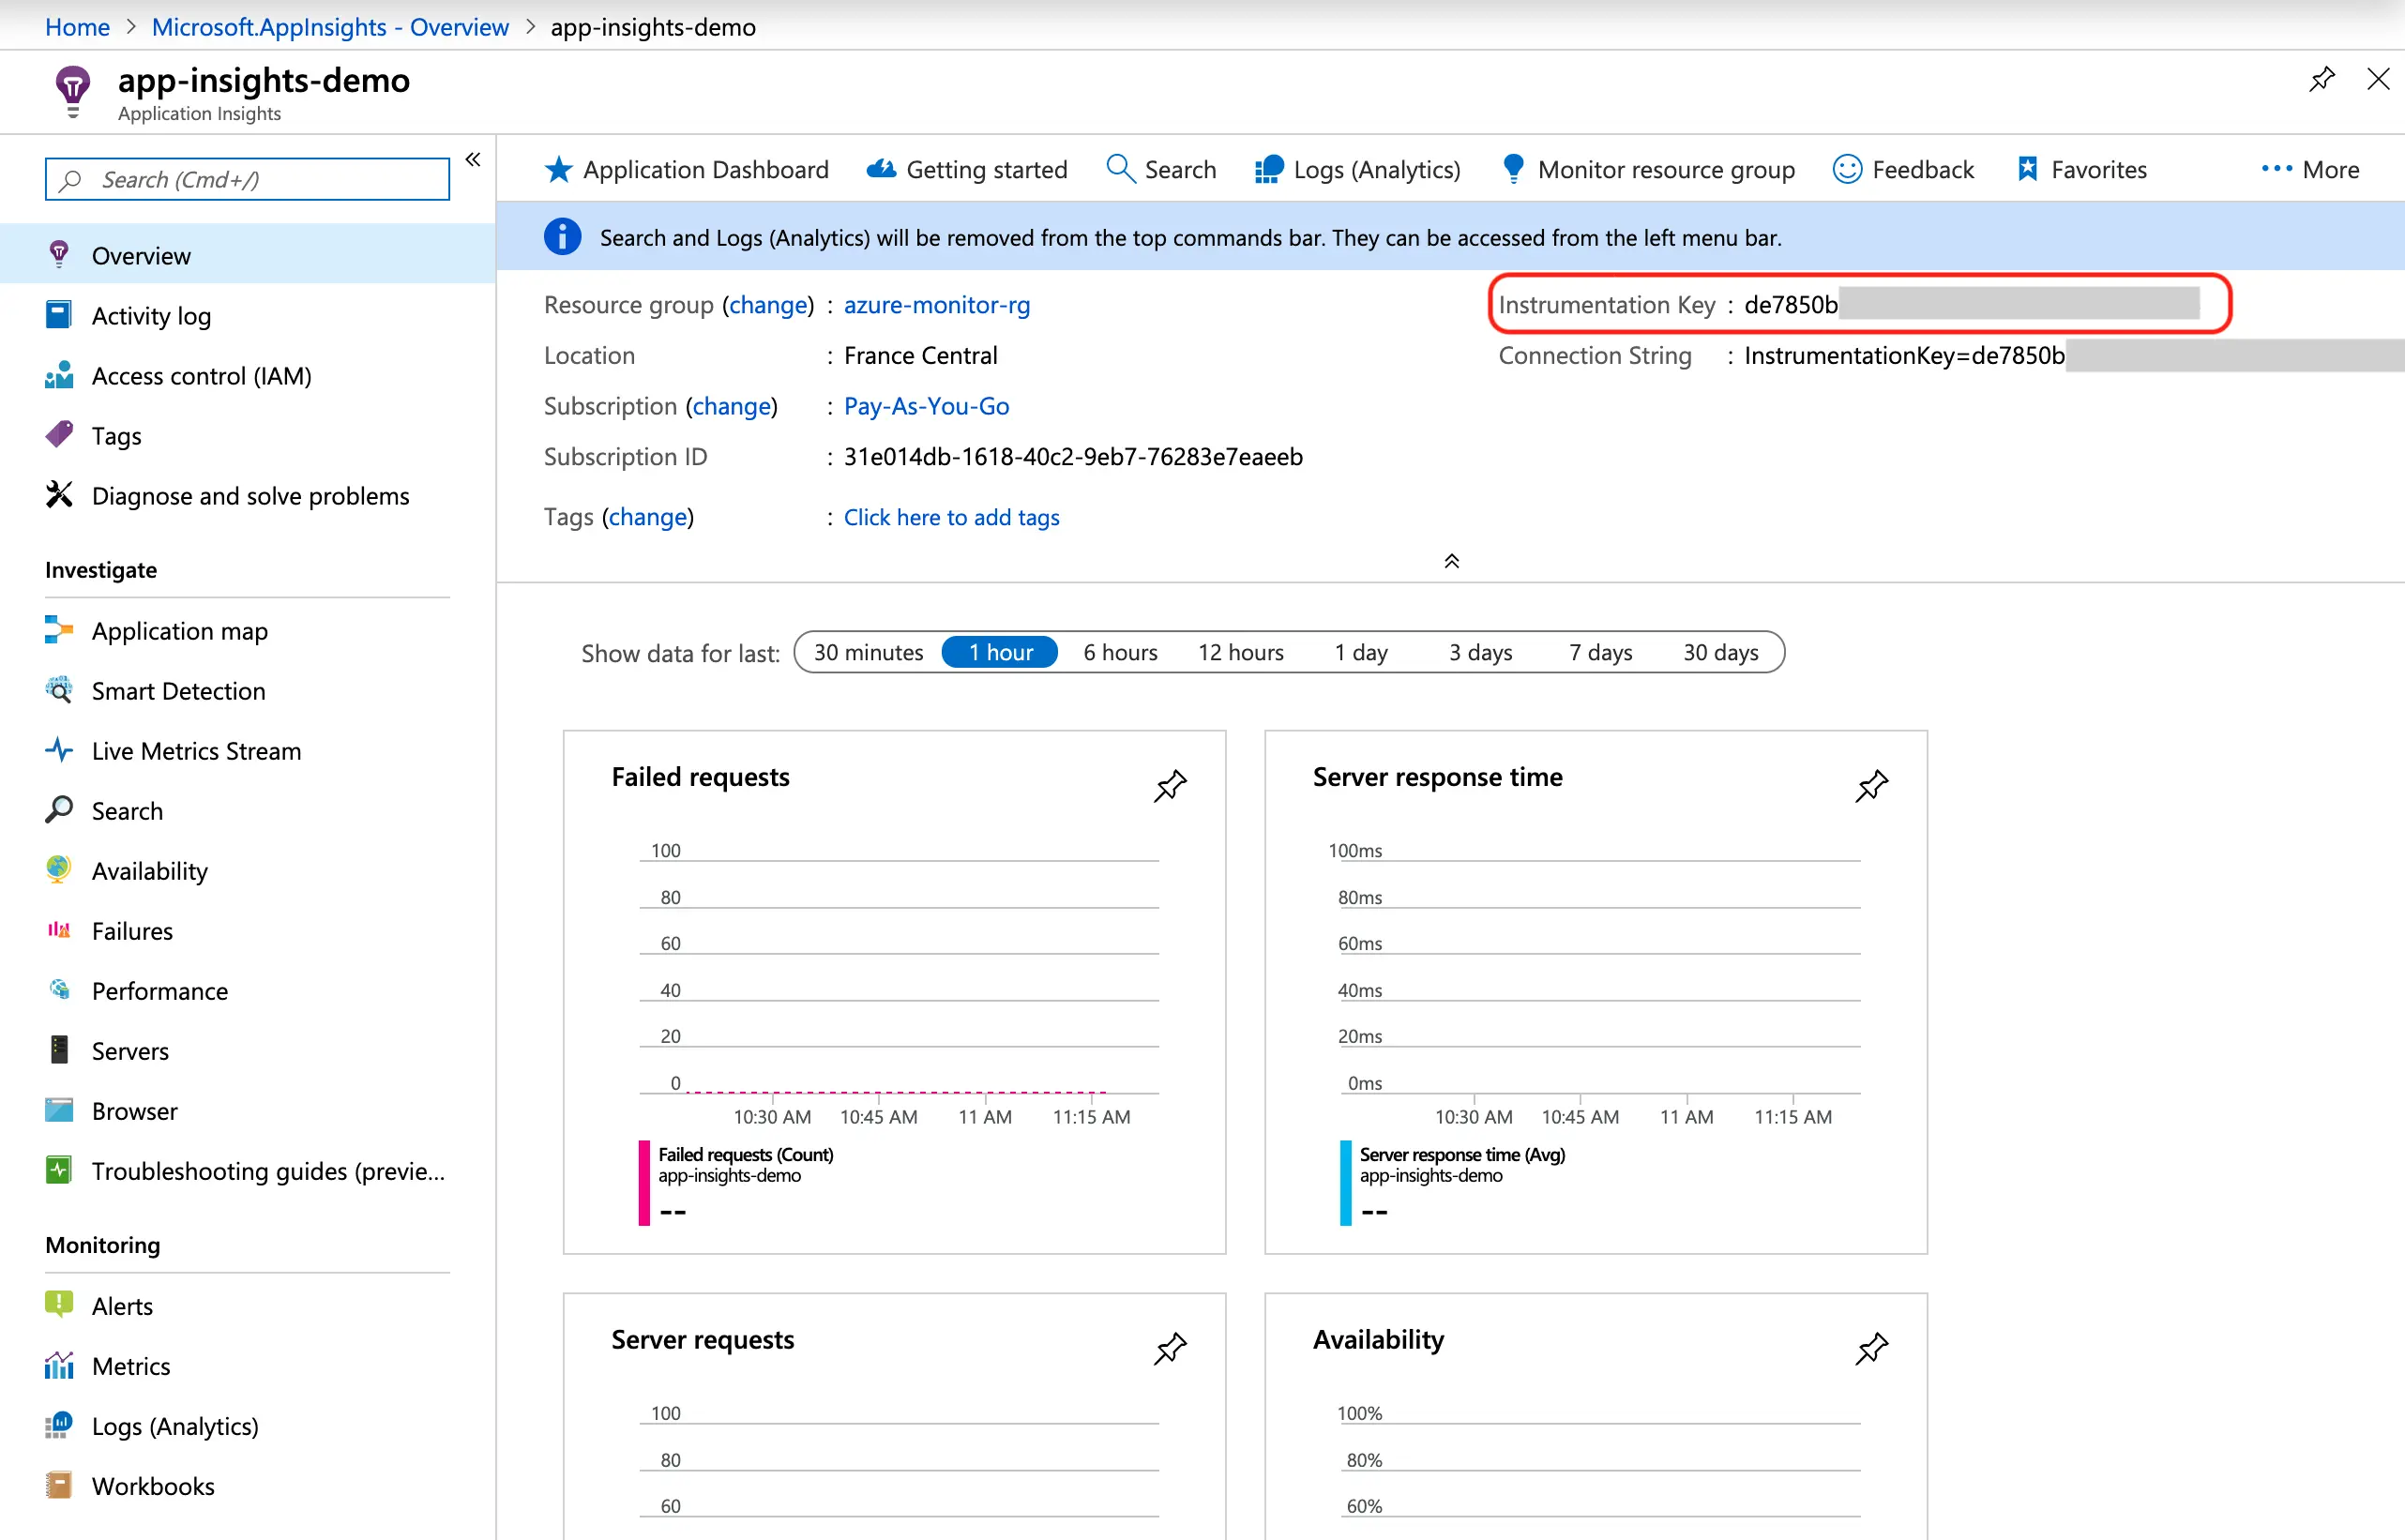
From this screen we need to grab the Instrumentation Key. This will be used from our application to communicate with Azure.
Next, in our Spring Boot project, we need to add the Application Insights Starter to the pom.xml:
| |
Next, we need to add some properties to the application.properties:
| |
Now, we have two steps of implementing the Application Insights support:
- Enabling the metrics emission
- Enabling the Logs broadcasting
1. Enabling the metrics emission
In our REST Controller, we will use a TelemetryClient instance to send telemetry to Azure Application Insights. Our controller will look like:
| |
Cool ! 🥳 But is these telemetries ? what is an Event ? a Trace ? a Metric ? a Dependency ?? 🤔
- Event telemetry: represents an event that occurred in your application. Typically it is a user interaction such as button click or order checkout. It can also be an application life cycle event like initialization or configuration update.Semantically, events may or may not be correlated to requests. However, if used properly, event telemetry is more important than requests or traces. Events represent business telemetry and should be a subject to separate, less aggressive sampling.
- Trace telemetry: represents a textual styled trace. Log file entries are translated into instances of this type. The trace does not have measurements as an extensibility.
- Metric telemetry: There are two types of metric telemetry : single measurement and pre-aggregated metric.
- Single measurement is just a name and value.
- Pre-aggregated metric specifies minimum and maximum value of the metric in the aggregation interval and standard deviation of it. It assumes that aggregation period was one minute.
- Dependency Telemetry: represents an interaction of the monitored component with a remote component such as SQL (like what we simulated in our example) or an HTTP endpoint.
- Request Telemetry: represents the logical sequence of execution triggered by an external request to your application. Every request execution is identified by unique
IDandurlcontaining all the execution parameters. You can group requests by logicalnameand define thesourceof this request. Code execution can result insuccessorfailand has a certainduration. Both success and failure executions may be grouped further byresultCode.
Just start the application and just call the REST Controller on http://localhost:8080/api/hello some times to generate some telemetries:
Here we go ! After some minutes, we get the results in the same Monitor > Application Insights > Search menu 😁
2. Enabling the Logs broadcasting
Spring Boot uses logback as the default logger. Azure does provide its own log-appender which has to be configured in our Spring Boot application. First you have to add the AppInsights log-appender as a new dependency:
| |
To configure the newly added log-appender you have to add a new configuration File /src/main/resources/logback-spring.xml to your app:
| |
Now, all your logging will be broadcasted automatically to our Application Insights instance.
If you go back to the Azure portal, next Azure Monitor, next to Application Insights, click on your application :
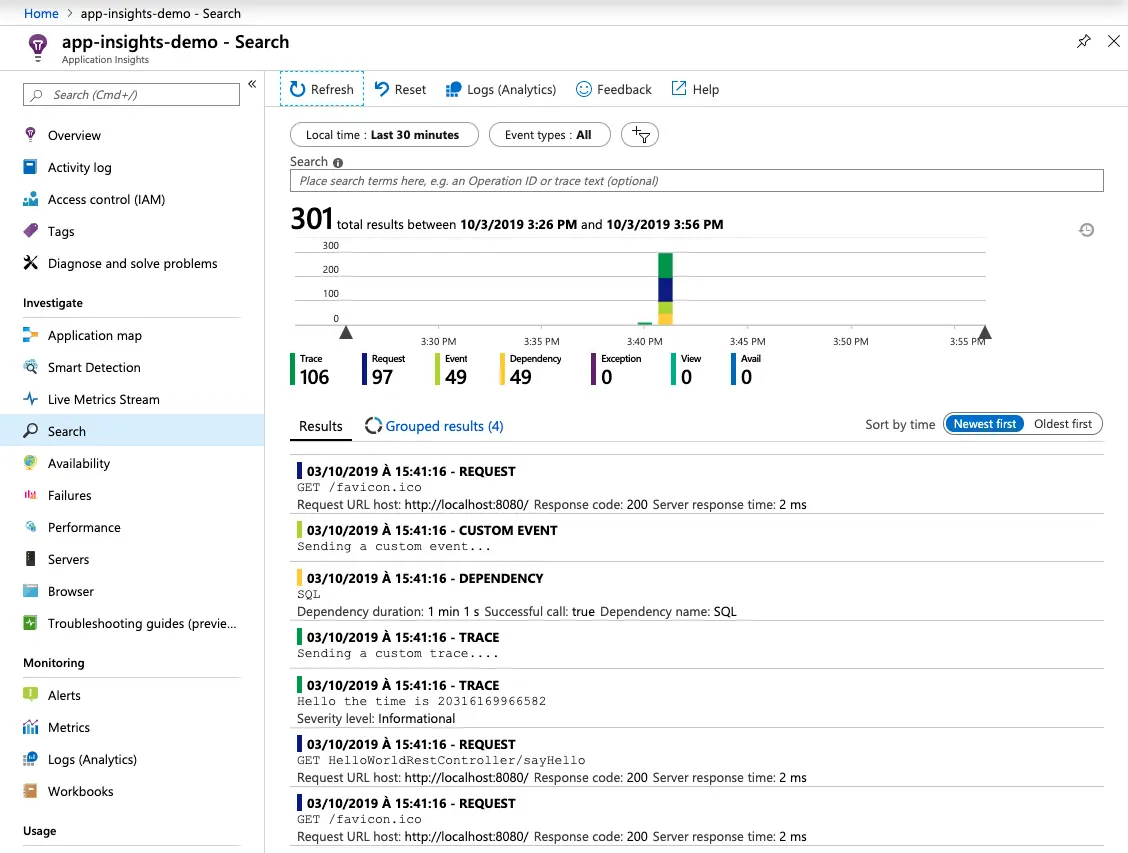
Now, click on Search to be forwarded to the listing of the received logs - if there are no logs; click on the Refresh button:
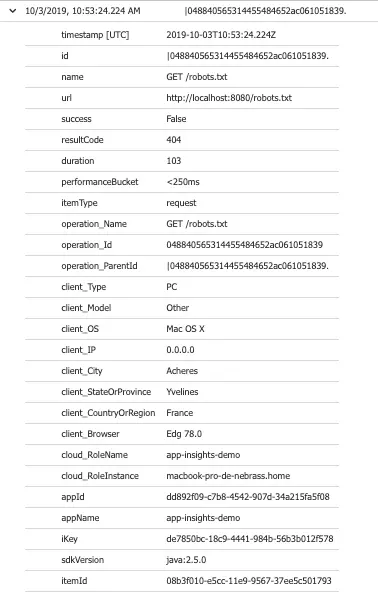
Click on a message to see the transaction details:
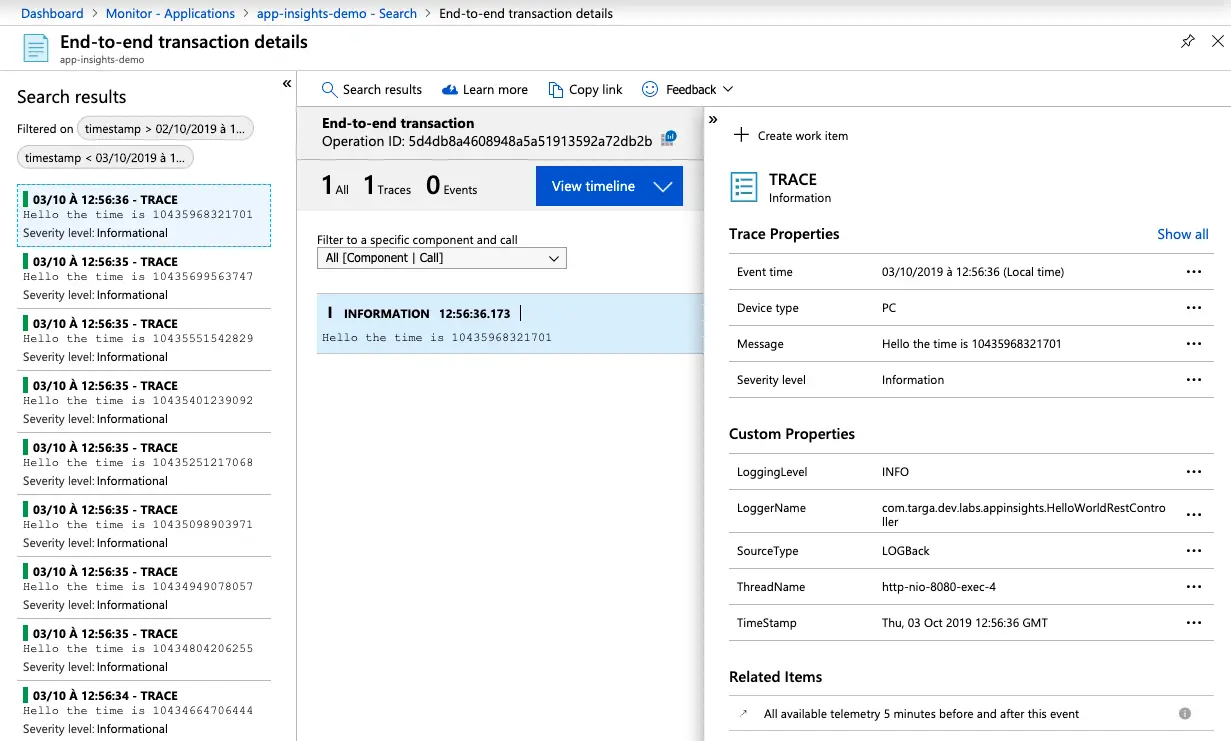
Cool ! Now we are sending logs and telemetries to our Azure Monitor ecosystem.
Log Analytics
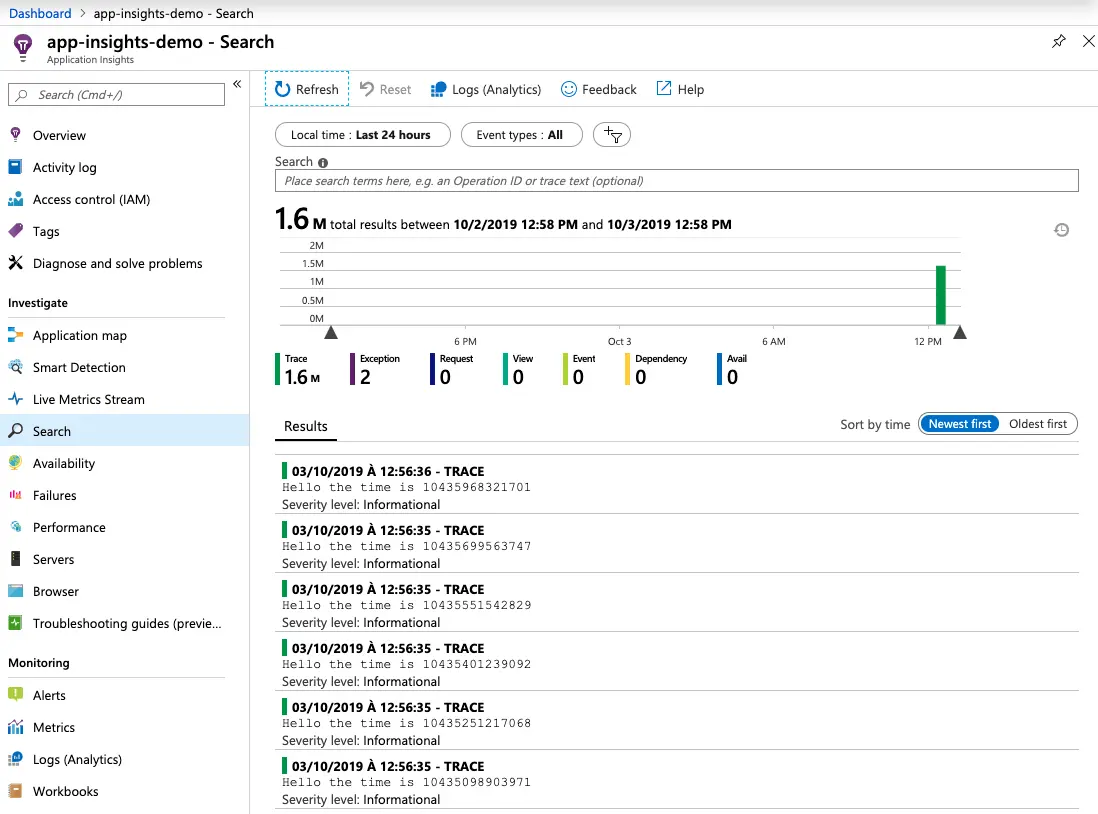
Log Analytics is a web tool used to write and execute Azure Monitor log queries. Open it by selecting Logs in the Azure Monitor menu:
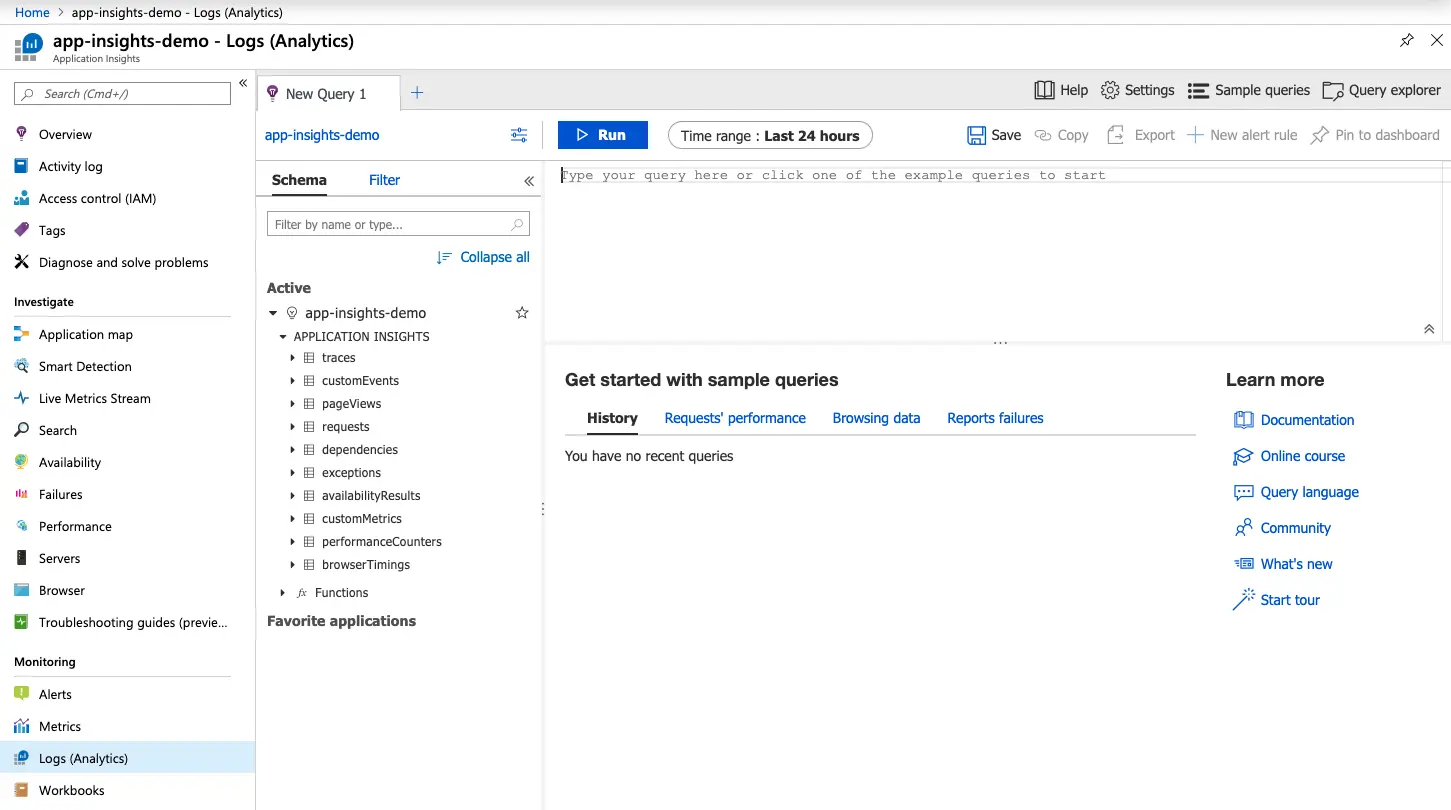
Now, you can type an Azure Logs Query in the editor.
For example, a query that lists the last 50 requests: requests | limit 50:
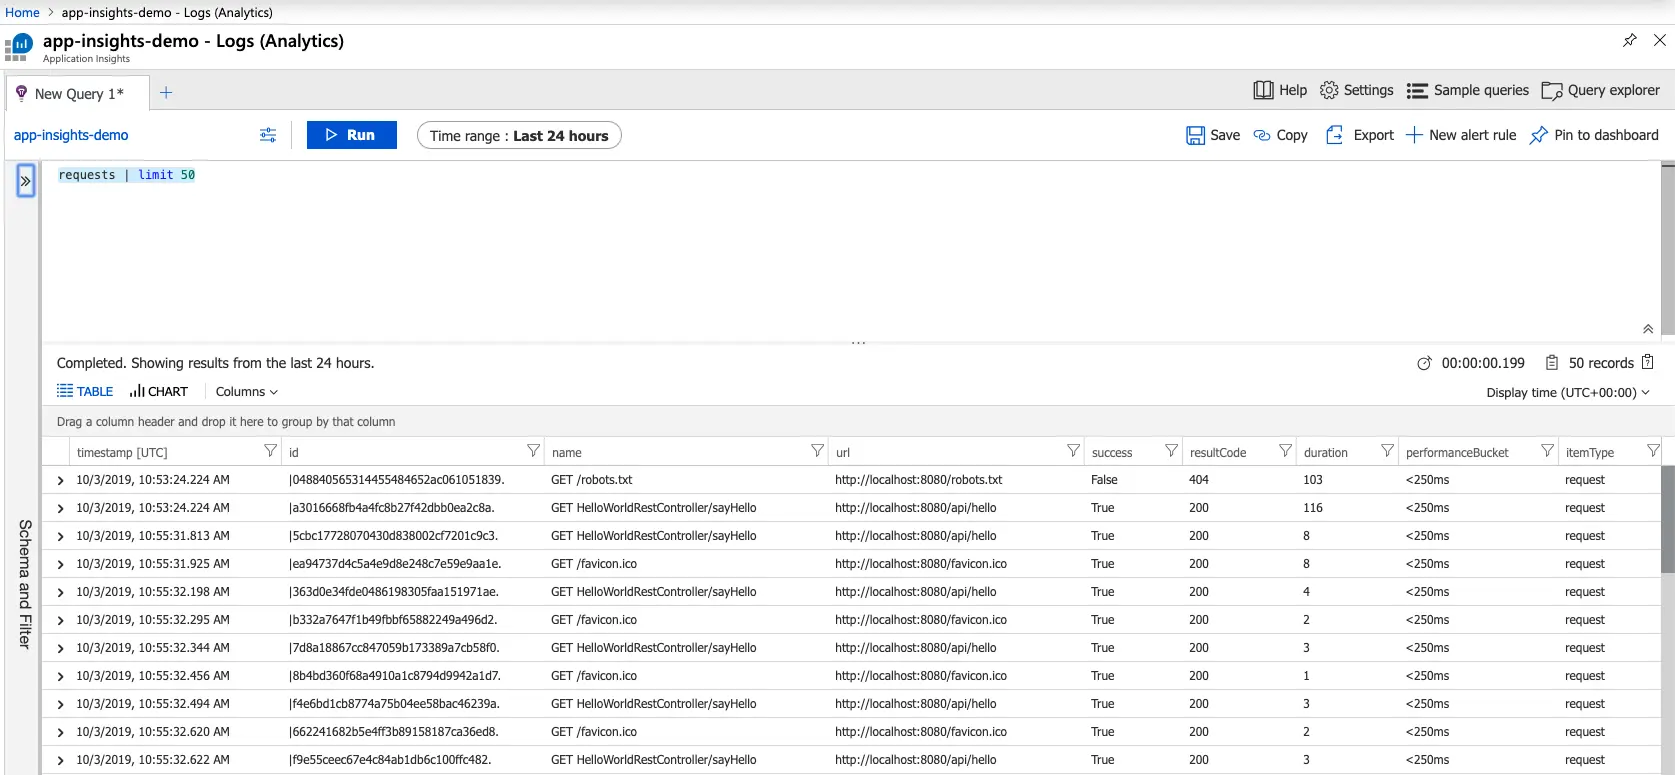
Now that we get the records, we can filter the results, sort them, check the record details to be able to be more productive by understanding what’s happening in our application.
We can even generate some graphs and charts to understand in deep how things are turning into the application. Even if we have some frequently used queries, we can store them. We can go far and export the records to PowerBI or Excel to play more with the data if you like that 🤓
Live metrics stream
With the Live Metrics Stream service, we can watch metrics and performance counters in real time, without any disturbance to the service. We can easily inspect the stack traces from sample failed requests and exceptions. It provides a powerful and non-invasive diagnostic tool for our live web applications.
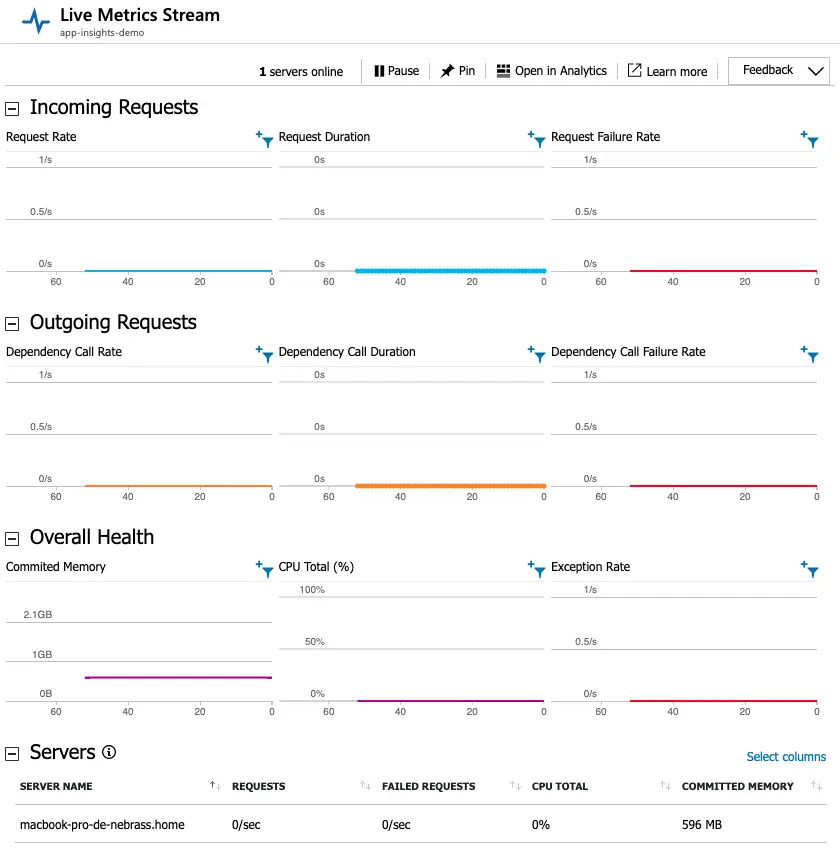
I’m sure that you are surprised by the actual values 😂 It’s quite because I didn’t generated so much noise 😴
With Live Metrics Stream, we can:
- Validate a fix while it is released, by watching performance and failure counts.
- Watch the effect of test loads, and diagnose issues live.
- Focus on particular test sessions or filter out known issues, by selecting and filtering the metrics you want to watch.
- Get exception traces as they happen.
- Experiment with filters to find the most relevant KPIs.
- Monitor any Windows performance counter live.
- Easily identify a server that is having issues, and filter all the KPI/live feed to just that server.
Performance Dashboard
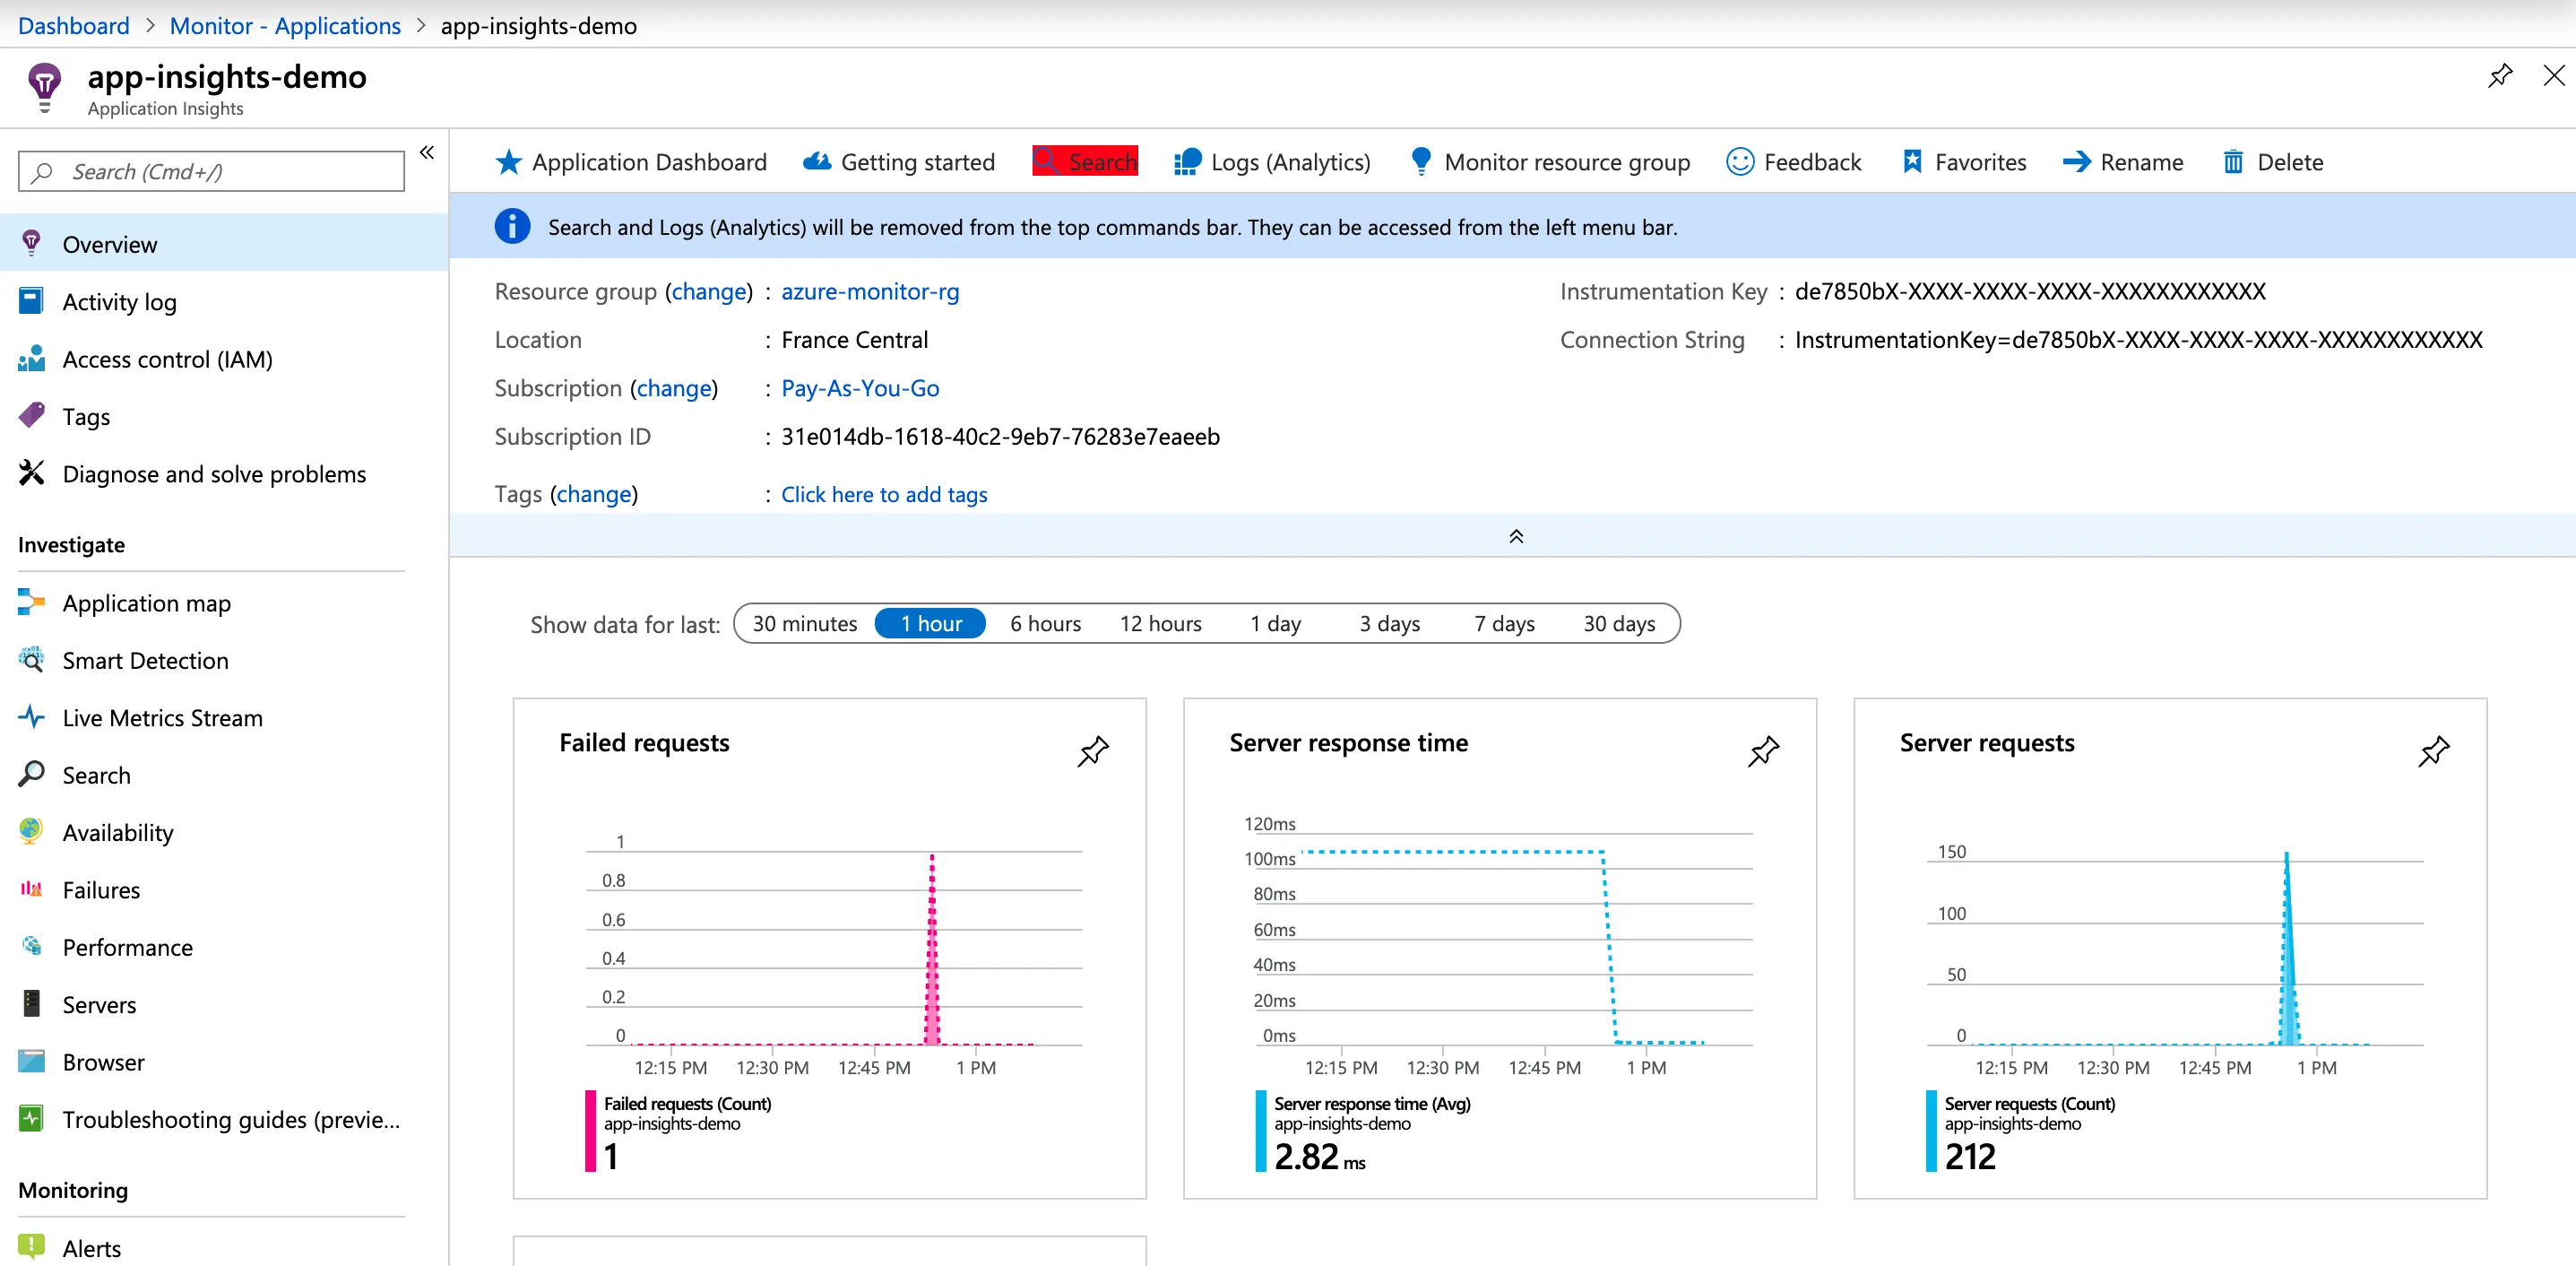
Application Insights collects performance details for the different operations in our application. By identifying those operations with the longest duration, we can diagnose potential problems or best target your ongoing development to improve the overall performance of the application.
- Select Application Insights.
- To open the Performance panel either select Performance under the Investigate menu OR click the Server Response Time graph.
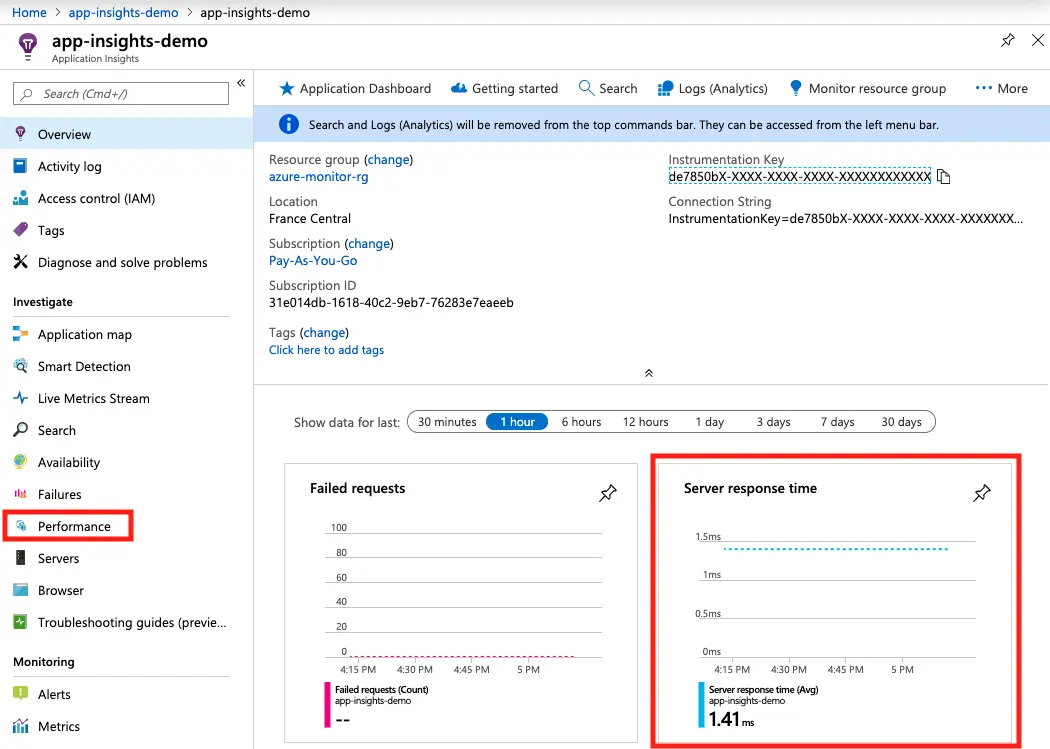
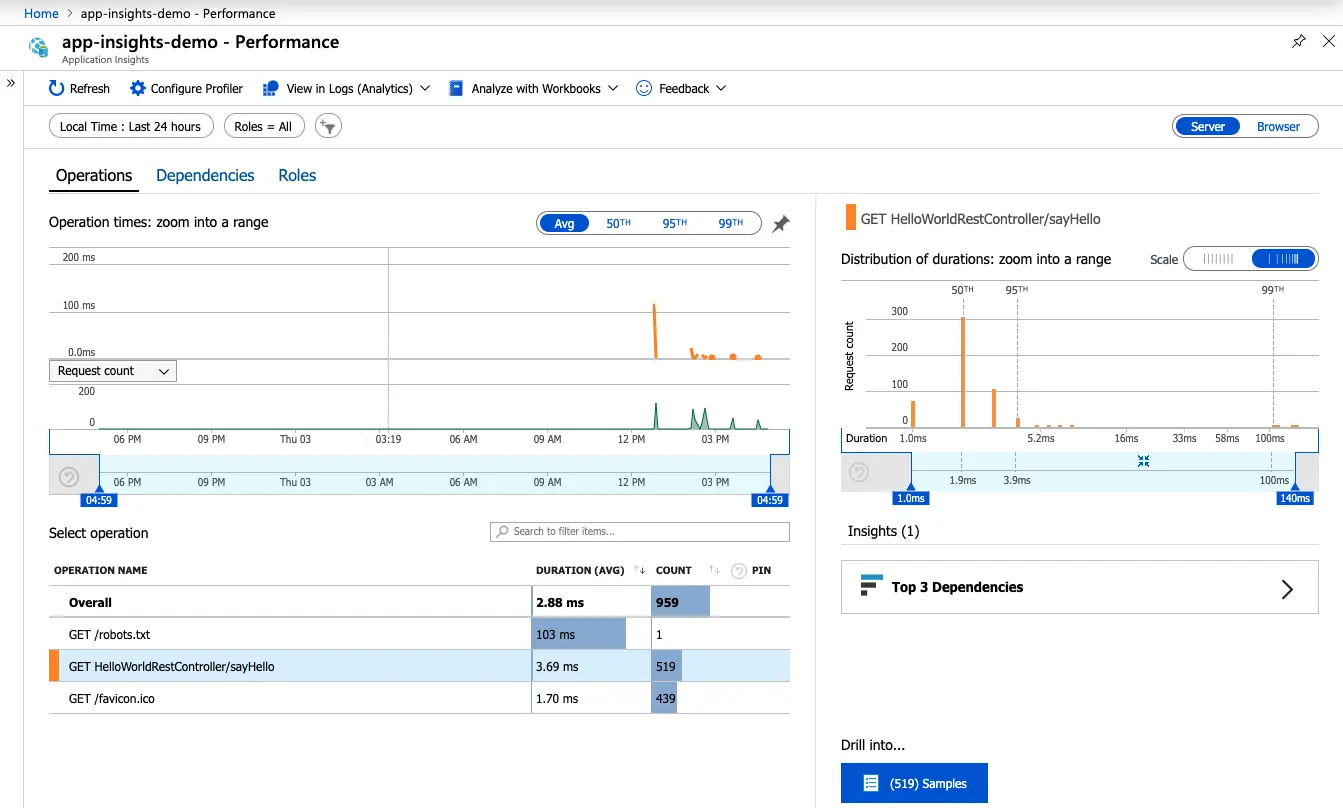
The Performance panel shows the count and average duration of each operation for the application. You can use this information to identify those operations that most impact users. In our example, the GET /robots.txt is a likely candidate to investigate because of its relatively high duration although it’s called only once (COUNT=1).
You can do more, just take a look on the documentation 🤓
Application Health with Azure Application Insights
Azure Application Insights allows us to monitor our application and send us alerts when it is either unavailable, experiencing failures, or suffering from performance issues.
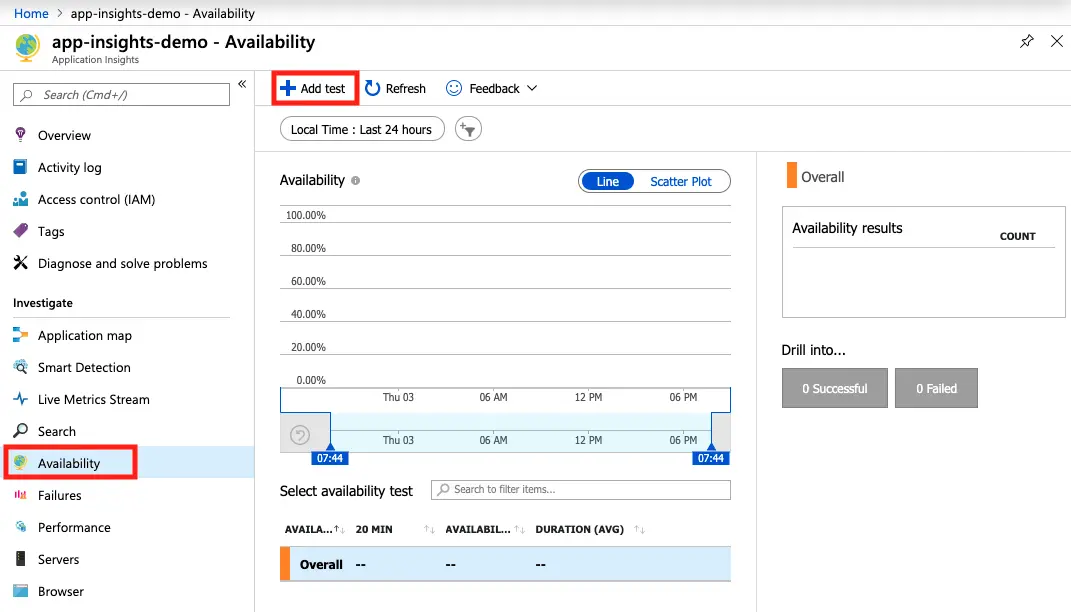
To continuously check the availability of our application, we need to create an availability test, used allow us to automatically test our application from various locations around the world.
To create an Availability Test, select Availability under the Investigate menu and then click Create test:
Next, we will fill the Test basic information:
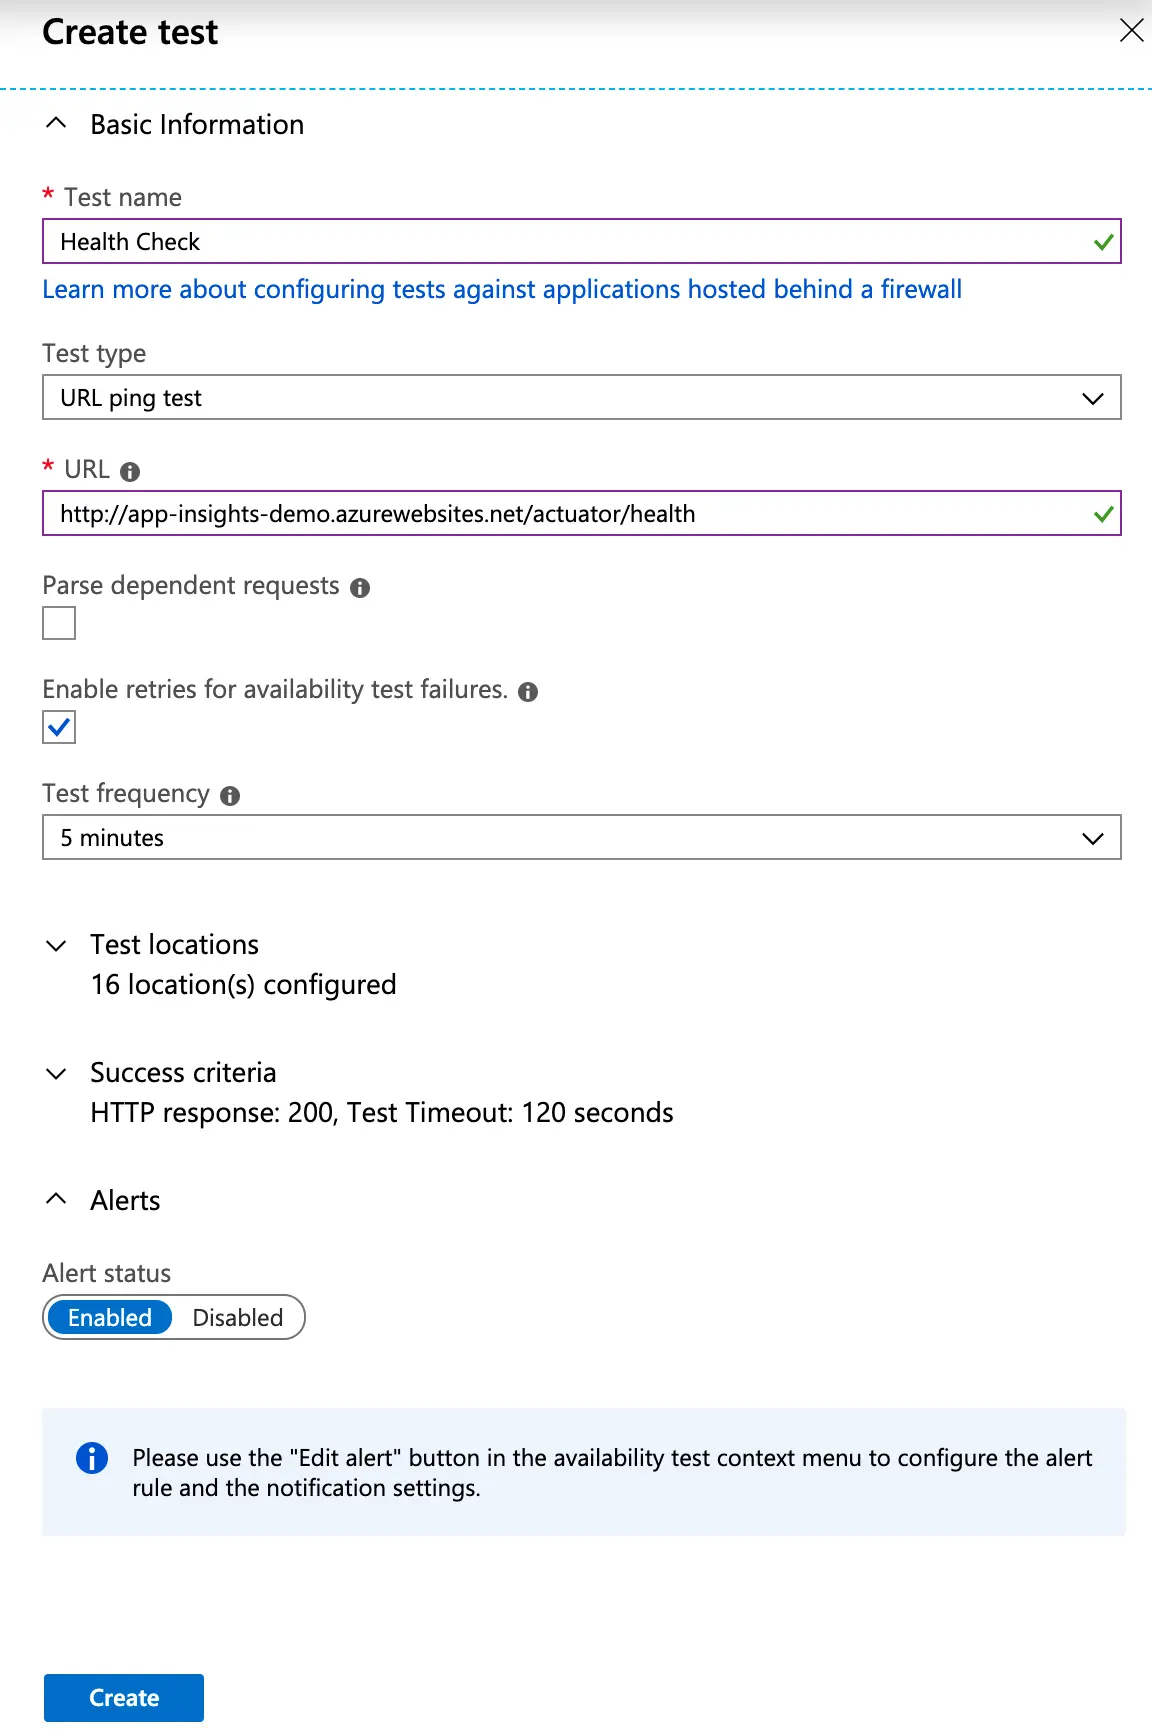
The Test basic informations:
- Name: Health Check
- Test Type: URL ping test
- URL: The actuator health check URI on one of my hosted application: http://app-insights-demo.azurewebsites.net/actuator/health
- We enabled the retries in case of a test fails - with a frequency of 5 minutes
- The tests will be run from 16 different locations
- The criteria of success of the test will be an HTTP 200 response within a 120 seconds.
- Alerts are enabled and can be customized from an other menu 😁
Now our test is created, we can check it and do some modifications like alert conditions or the alert :
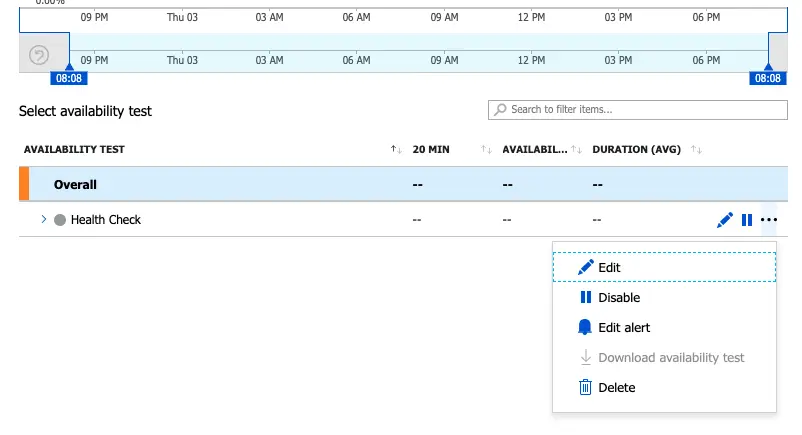
We can see that, by default, the alert will be dispatched only if the test failed from 8 locations or more:
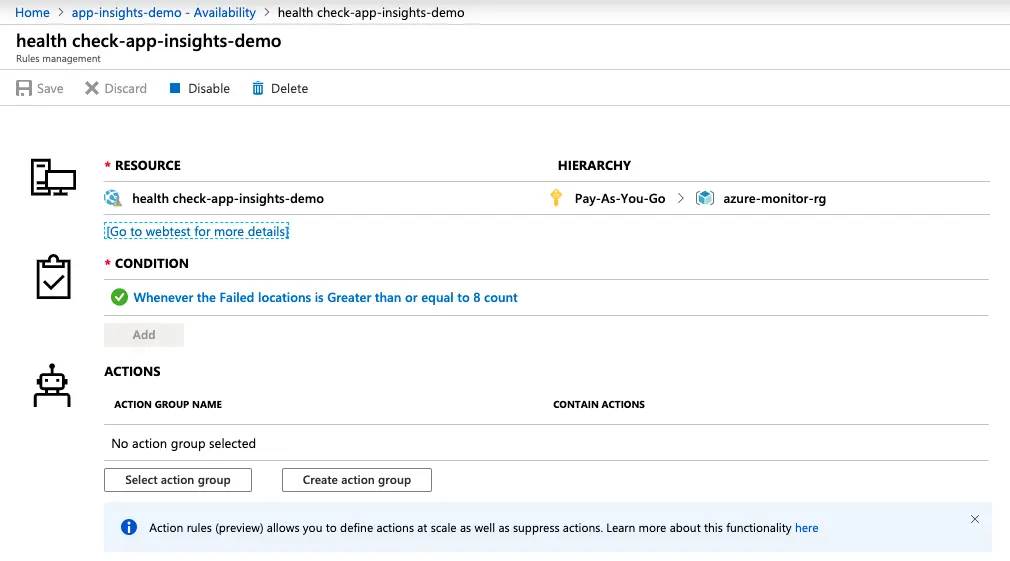
In the Actions, we need to select an Action Group in matter to define the group that will receive the alert.
Next steps
In this post, we did a small tour in the Azure Monitor services and I hope you could get an idea about how this great product works ? and what you can do with ?
I used before the ELK/EFK and Dynatrace, and I found that they are so good as a couple to monitor and track what’s going on on applications and microservices. In comparaison, I really appreciate the Azure Monitor services and I found them complete and exhaustive and all the features you need are in one place. Give it a try, I will be interested by your feedback 😊