Introduction
Here we go again for a new post! This time, I’m sharing something that has been bugging me for a while now.
I’ve been using WSL2 as my daily driver for months — coding, running containers, building projects. But I always had this feeling that something was off. My Windows machine would become sluggish after a few hours of WSL2 usage, I was only using a fraction of my CPU cores, and every time I wanted to test a web application visually, I had to leave the terminal and switch to the browser manually.
Then I discovered two things that changed my setup completely:
- WSL2 has two configuration files — and the defaults are terrible for development workloads
- Chrome DevTools Protocol can be exposed to WSL2, so agentic CLI tools like Claude Code, Gemini CLI, and GitHub Copilot can actually see and interact with your browser
Let me show you what I did.
Part 1: Optimizing WSL2 Configuration
WSL2 has two configuration files that control its behavior:
| File | Location | Scope |
|---|---|---|
.wslconfig | C:\Users\<you>\.wslconfig | Global — applies to all WSL2 distros |
wsl.conf | /etc/wsl.conf inside the distro | Per-distro settings |
Both require a wsl --shutdown from PowerShell to take effect. Don’t be scared by the number of settings — most of them are set-and-forget.
The .wslconfig file (Windows-side)
This file controls how much hardware WSL2 can use. The defaults are surprisingly conservative — or in some cases, surprisingly greedy.
Before writing your config, let’s check what you’re working with:
| |
Now create or edit C:\Users\<you>\.wslconfig:
| |
Sizing guide
Use this as a starting point — adjust based on how much multitasking you do on the Windows side:
| Your total RAM | memory= | Your logical CPUs | processors= |
|---|---|---|---|
| 16 GB | 12GB | 8 | 6 |
| 32 GB | 24GB | 12 | 8 |
| 64 GB | 48GB | 16 | 10 |
| 128 GB | 96GB | 22+ | 14-16 |
The goal is to give WSL2 enough resources for builds, containers, and dev servers — while keeping Windows responsive for your browser, editor, and meetings.
What’s going on here?
processors: A common mistake is leaving this at the default (which varies by WSL version) or setting it too low. Run the PowerShell commands above to see your actual thread count, and allocate accordingly.
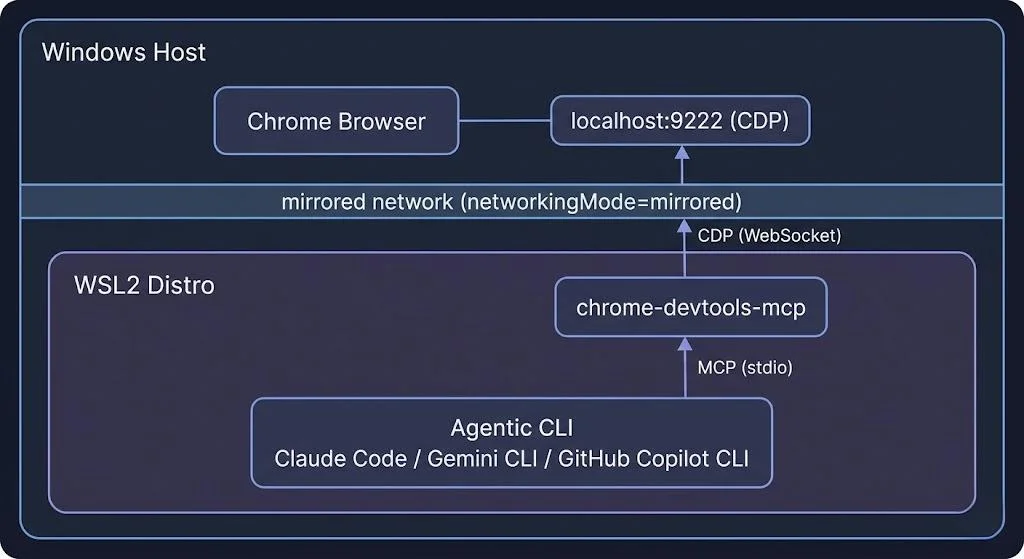
networkingMode=mirrored: This is the key setting that makes the Chrome DevTools setup work! With mirrored networking, localhost is shared between Windows and WSL2. A Chrome instance listening on localhost:9222 on Windows is directly accessible from WSL2 without any port forwarding. Cool!
⚠️ Warning:
mirrorednetworking can break Docker Desktop. This is actually a good reason to ditch Docker Desktop entirely and run Docker Engine natively inside WSL2 instead.Docker Desktop adds a separate WSL2 backend distro, its own networking layer, and a GUI process that consumes resources — all unnecessary overhead when you already have a full Linux environment in WSL2.
Installing Docker Engine directly inside your WSL2 distro gives you:
- No networking conflicts with
mirroredmode- Lower memory usage — no extra Docker Desktop VM or backend distro
- Full control over Docker daemon configuration
- Faster I/O — containers access the native ext4 filesystem directly
Follow the official Docker Engine install guide for Ubuntu (or your distro) inside WSL2. Once installed, just
sudo systemctl enable dockerand you’re set — no Desktop app needed.
autoMemoryReclaim=gradual: This one is a game changer. Without it, WSL2 acts like a memory black hole — it allocates RAM as needed but never releases it, even after processes exit. The gradual setting lets the Linux kernel slowly return unused pages to Windows. If you’ve ever wondered why your Windows machine feels sluggish after running WSL2 for a while — this is why.
sparseVhd=true: WSL2 stores your Linux filesystem in a .vhdx virtual disk. By default, this file only grows. Delete 10GB of files? The .vhdx stays the same size. This setting enables automatic compaction. Trust me, you want this.
The wsl.conf file (Linux-side)
Now let’s configure the Linux side. This file lives inside your WSL2 distro at /etc/wsl.conf:
| |
What each section does
systemd=true: Enables systemd inside WSL2, which is required for running services like Docker, PostgreSQL, or any daemon that expects a proper init system.
command="sysctl -w vm.max_map_count=262144": This kernel parameter is required by Elasticsearch and OpenSearch. Without it, these services crash on startup with a cryptic error. Setting it in the [boot] section ensures it’s applied every time WSL starts.
metadata mount option: This one is critical. Without it, all files on Windows-mounted drives (/mnt/c/, etc.) appear with chmod 777 permissions. This breaks:
- SSH keys (which require
600permissions) - Git operations (which detect permission changes as modifications)
- Any tool that checks file permissions
case=off: Prevents case-sensitivity issues when Windows tools (VS Code, file explorer) interact with files on mounted drives. Without this, you can accidentally create File.txt and file.txt in the same directory — which Windows doesn’t support.
appendWindowsPath=true: Lets you call Windows executables directly from WSL2. This means code . opens VS Code, explorer.exe . opens File Explorer, and — importantly for our next section — you can launch Chrome from the WSL2 terminal.
Let’s verify it works!
After editing both files, shut down WSL2:
| |
Then reopen your WSL2 terminal and verify:
| |
Good ! If everything looks good — we’re ready for the fun part!
Part 2: Chrome DevTools MCP from WSL2
What is MCP and why should I care?
The Model Context Protocol (MCP) is an open standard that lets AI tools connect to external systems through a unified interface. Think of it as a plugin system for AI assistants.
The Chrome DevTools MCP server exposes Chrome’s DevTools Protocol through MCP, allowing agentic CLI tools to:
- Navigate to URLs and take screenshots
- Click elements, fill forms, and interact with pages
- Inspect network requests and console logs
- Run Lighthouse audits for performance, accessibility, and SEO
- Execute JavaScript in the page context
This works with any agentic CLI that supports MCP servers — Claude Code, Gemini CLI, GitHub Copilot CLI, and more.
Architecture
The setup is actually simple thanks to networkingMode=mirrored:
Step 1: Create a Chrome launcher script
Chrome needs to be started with --remote-debugging-port to expose the DevTools Protocol. Let’s create a helper script:
| |
ℹ️ Note: The
--user-data-dirflag creates a separate Chrome profile inC:\Temp\chrome-debug-profile. This means the debug Chrome instance won’t interfere with your regular browsing session — different tabs, different extensions, different cookies.
Good ! Make sure ~/.local/bin is in your PATH. Add this to your ~/.zshrc or ~/.bashrc if it’s not:
| |
Step 2: Configure the MCP server
Now, the configuration depends on which agentic CLI tool you use. Keep calm, I got you covered for the most popular ones. Here we go!
Claude Code
Add to ~/.claude.json under mcpServers:
| |
Gemini CLI
Add to ~/.gemini/settings.json:
| |
GitHub Copilot (VS Code)
Add to your VS Code settings.json:
| |
GitHub Copilot CLI
Add to ~/.copilot/mcp-config.json:
| |
ℹ️ Note: The Copilot CLI uses
"type": "local"and requires a"tools"field to specify which tools to enable.["*"]enables all available tools.
Step 3: Let’s test it!
- Launch Chrome with debugging:
| |
- Verify the connection:
| |
You should see something like:
| |
If you see this — Cool ! It works!
- Now from your agentic CLI, try interacting with the browser. For example, in Claude Code:
“Navigate to https://example.com and take a screenshot”
The tool should navigate Chrome, capture the page, and return the screenshot directly in the conversation. Pretty cool, right?
What can you do with this?
Once connected, your agentic CLI can:
| Capability | Example use case |
|---|---|
| Navigate & screenshot | Visual regression testing, design review |
| Click & fill forms | End-to-end testing, form automation |
| Network inspection | Debug API calls, check request/response payloads |
| Console logs | Catch JavaScript errors during development |
| Lighthouse audits | Performance, accessibility, and SEO checks |
| Execute JavaScript | Extract data, test DOM manipulations |
| Performance tracing | Profile page load, find bottlenecks |
This turns your terminal-based AI assistant into something that can actually see and interact with your web applications.
Conclusion
That’s all folks! In this post, we went through two things that significantly improved my daily development workflow on Windows with WSL2:
- Tuning WSL2 — two small configuration files (
.wslconfigandwsl.conf) that can dramatically change how WSL2 behaves, especiallyautoMemoryReclaimandnetworkingMode=mirrored - Chrome DevTools MCP — connecting Chrome running on Windows to agentic CLI tools inside WSL2, so they can actually see and interact with web pages
The Chrome DevTools MCP server is open source and actively maintained at github.com/ChromeDevTools/chrome-devtools-mcp. It works with any MCP-compatible tool, making it a vendor-neutral solution for browser automation from the terminal.
I really encourage you to try this setup — especially the mirrored networking + Docker Engine combo. Once you get rid of Docker Desktop, you won’t miss it!
Cheers!