
The serverless architecture became one of the most buzzy words nowadays. Almost all the cloud providers have a Serverless platforms in their catalogues:
- Microsoft Azure Functions
- Amazon Web Services Lambda
- Google Cloud Functions
- IBM Cloud Functions
- Oracle Functions
In an other world, there are many solutions to have a Serverless Runtime into Kubernetes, which is the most popular (and the most wonderful) container orchestrator in the market. These solutions are so helpful especially if you need portability for your functions. For example, you can have the same Serverless Runtime deployed to Azure Kubernetes Service and Google Kubernetes Engine. You can be deploying the same binaries as functions identically to both of the cloud providers.
In this tutorial, I will demonstrate how to deploy a Serverless Framework to Minikube and on which we will deploy some Functions based on Spring Boot Framework.
There are many serverless runtimes for Kubernetes:
- Kubeless
- Knative
- Fission
- OpenFaas
- OpenWhisk
- Fn Project
- and maybe there is an other framework that appears while I’m writing this post 😁
For this first tutorial, I will choose Knative 😄
What is Knative?
Based on the Knative Documentation:
Knative extends Kubernetes to provide a set of middleware components that are essential to build modern, source-centric, and container-based applications that can run anywhere: on premises, in the cloud, or even in a third-party data center.
Each of the components under the Knative project attempt to identify common patterns and codify the best practices that are shared by successful, real-world, Kubernetes-based frameworks and applications.
Developers on Knative can use familiar idioms, languages, and frameworks to deploy functions, applications, or containers workloads.
The shortest definition that I like for Knative: a platform to build and run Serverless applications on Kubernetes:
- The Build features are offered via a set of building blocks for creating container images from source code. ⚠️⚠️ Before the v0.8, Knative had its own Build component. Since the v0.8, Knative Build is deprecated in favor of Tekton 🐱 ⚠️⚠️
- The Run features are provided via two high level components:
- Serving provides the possibility to deploy and serving functions and serverless applications. It includes automatic scale-to-zero function. Knative’s Serve component offers two important features for container management.:
- The first feature is multiple-configuration: offers the ability to create different versions of the same container-based service and run them concurrently, and this is where the other feature of its serving component comes into play.
- The second feature is service routing: offers the ability to do A/B Testing: route a subset of our users to the new version of service, while keeping the rest of the users routed to the old version. This process is helpful to ensure that the new version has no killers before totally migrating to it 😁
- Eventing provides blocks for defining, consuming and producing events to bind event sources to services. This component define also the triggering actions based on them within a cloud-native environment.
- Serving provides the possibility to deploy and serving functions and serverless applications. It includes automatic scale-to-zero function. Knative’s Serve component offers two important features for container management.:
To ensure the Serving & Eventing, Knative is based on the powerful Istio Service Mesh features to expose, monitor, control the services and to encrypt the transiting data.
The Knative high-level ecosystem looks like:
 Knative high-level ecosystem
What’s this kitty looking to the deprecated Build component ? This is actually Tekton.
Tekton does not belong to Knative as internal component, but it’s adopted by Knative as its recommended CI/CD pipelines.
I will be covering Tekton Pipelines in a dedicated tutorial. Stay tuned 📻🎶😁
Why Knative ?
Knative is an source platform developed and supported by very big companies like IBM, Google, Pivotal… Knative is designed and developed based of the needs and the latest standards of the market. It is mainly developer focused, this is why all the features are developer friendly. With Knative, developers will be focusing only on implementing the business logic in the source code and avoid them the waste of effort/time related to building, deploying and managing the environment, which is the core principle of the serverless architecture. The key part is to package the code in Containers that can be deployed to Kubernetes via the Knative pipelines.
With the integration with Kubernetes, Knative boosts its position by adopting Istio as core Service Mesh solution.
Now, let’s move to the practical part of this post.
Installing the requirements of Knative
Knative requires the having a Kubernetes cluster with Istio Service Mesh deployed 🤓
I will be using Minikube as local Kubernetes cluster.
Configuring Minikube
So, we will start by configuring Minikube. I suppose that you already installed the VM Driver and Minikube binaries for your OS 🥳
We will start by creating a new minikube profile:
| |
Next, we will start the minikube with our custom configuration:
| |
Now, we need to install Istio Service Mesh on our Minikube cluster 😁
Installing Istio
This tutorial will cover the installation of Istio v1.1.7.
Downloading Istio and installing Custom resources definitions
Download Istio Service Mesh files:
1 2 3$ export ISTIO_VERSION=1.1.7 $ curl -L https://git.io/getLatestIstio | sh - $ cd istio-${ISTIO_VERSION}We will install the Istio CRDs:
1$ for i in install/kubernetes/helm/istio-init/files/crd*yaml; do kubectl apply -f $i; doneNow, we need to create a namespace with a label
istio-injection: disabled. To do that:1 2$ kubectl create ns istio-system $ kubectl label ns istio-system istio-injection=disabledNow we will proceed to install Istio without Sidecar Injection, which is the recommended default installation 🥳 We need to build the resources file based on the template :
1 2 3 4 5 6 7 8 9 10 11 12 13 14 15 16 17 18 19 20 21 22 23 24$ helm template --namespace=istio-system \ --set prometheus.enabled=false \ --set mixer.enabled=false \ --set mixer.policy.enabled=false \ --set mixer.telemetry.enabled=false \ `# Pilot doesn't need a sidecar.` \ --set pilot.sidecar=false \ --set pilot.resources.requests.memory=128Mi \ `# Disable galley (and things requiring galley).` \ --set galley.enabled=false \ --set global.useMCP=false \ `# Disable security / policy.` \ --set security.enabled=false \ --set global.disablePolicyChecks=true \ `# Disable sidecar injection.` \ --set sidecarInjectorWebhook.enabled=false \ --set global.proxy.autoInject=disabled \ --set global.omitSidecarInjectorConfigMap=true \ --set gateways.istio-ingressgateway.autoscaleMin=1 \ --set gateways.istio-ingressgateway.autoscaleMax=2 \ `# Set pilot trace sampling to 100%` \ --set pilot.traceSampling=100 \ install/kubernetes/helm/istio \ > ./istio-minimal.yamlThe final step will be to create the resources based on the generated file:
1$ kubectl apply -f istio-minimal.yamlNow, we need to verify that everything is working fine :
1$ kubectl get pods --namespace istio-systemThe output will looks like:
1 2 3NAME READY STATUS RESTARTS AGE istio-ingressgateway-57dfd8fd67-gf27c 1/1 Running 0 112m istio-pilot-6fb7569c86-rhk5n 1/1 Running 0 112mAs everything is working as expected, now we can proceed to install Knative 🥳
Installing the Knative
After installing Istio Service Mesh, we will install Knative:
As we did for Istio, we need to install the Knative CRDs:
1 2 3 4$ kubectl apply --selector knative.dev/crd-install=true \ --filename https://github.com/knative/serving/releases/download/v0.10.0/serving.yaml \ --filename https://github.com/knative/eventing/releases/download/v0.10.0/release.yaml \ --filename https://github.com/knative/serving/releases/download/v0.10.0/monitoring.yamlThis command will install these CRDs:
- apiserversources.sources.eventing.knative.dev
- brokers.eventing.knative.dev
- certificates.networking.internal.knative.dev
- channels.messaging.knative.dev
- configurations.serving.knative.dev
- containersources.sources.eventing.knative.dev
- cronjobsources.sources.eventing.knative.dev
- eventtypes.eventing.knative.dev
- images.caching.internal.knative.dev
- ingresses.networking.internal.knative.dev
- inmemorychannels.messaging.knative.dev
- metrics.autoscaling.internal.knative.dev
- parallels.messaging.knative.dev
- podautoscalers.autoscaling.internal.knative.dev
- revisions.serving.knative.dev
- routes.serving.knative.dev
- sequences.messaging.knative.dev
- serverlessservices.networking.internal.knative.dev
- services.serving.knative.dev
- subscriptions.messaging.knative.dev
- triggers.eventing.knative.dev
We need to install Knative and all its dependencies now:
1 2 3$ kubectl apply --filename https://github.com/knative/serving/releases/download/v0.10.0/serving.yaml \ --filename https://github.com/knative/eventing/releases/download/v0.10.0/release.yaml \ --filename https://github.com/knative/serving/releases/download/v0.10.0/monitoring.yamlThese commands will create 245 resources 🤪 divised like:
- 3 Namespaces
- 37 ClusterRole
- 14 ServiceAccount
- 17 ClusterRoleBinding
- 8 RBAC Role
- 6 RoleBinding
- 21 CRDs
- 32 ConfigMaps
- 15 Deployment
- 15 ReplicaSet
- 16 Services
- 20 Pods
- 2 StatefulSet
- 2 DaemonSet
- 1 HorizontalPodAutoscaler
- …
Before moving to the next step, we need to verify that all the pods are running:
1$ kubectl get pods --all-namespacesNow that your cluster has Knative installed, you’re ready to deploy an app. 😁
PREPARING OUR SAMPLE APPLICATION
We will generate a new Spring Boot application with the Web dependency. We will create a new RestController:
| |
Now, I will package this beautiful application 😜 in a Docker 🐳 container. I will be using the great Google Jib Maven plugin. To do that I will add the plugin in the build section of the pom.xml:
| |
The credHelper section will tell the plugin to get my Docker Hub credentials from the Mac OS Keychain, where I stored them 😁 for sure I will not be happy to share them 😜
Let’s build the project now:
| |
Good ! But this is an over engineered solution for our minikube proof-of-concept. Instead, we can use the minikube local Docker registry. The Jib plugin configuration will look like:
| |
Before building the Docker container, don’t forget to map the environment to the minikube local environment:
| |
Now, the container will be built in the local Docker daemon and pushed into the minikube local registry.
Now, we need to create a Knative Service (aka ksvc). The ksvc definition file looks like:
| |
Now, let’s create the ksvc resource from the this ksvc.yaml file:
| |
Now that our KService is created, Knative will perform the following steps:
- Create a new immutable revision for this version of the app.
- Network programming to create a route, ingress, service, and load balancer for our app.
- Automatically scale our pods up and down (including to zero active pods).
To check the listing of the KServices:
| |
The URL section is the one that interests us now: http://spring-knative-application.default.example.com
We will be using this value for consuming our KService. But before, we need to get the Istio Ingress Gateway IP address and port:
| |
In Knative, KService is reachable on:
 Knative KService access path
We can for example access the /api/hello REST API on our spring-knative-application ksvc via curl :
| |
We can use also httpie, my preferred tool:
| |
The request parameters are:
spring-knative-application.default.example.com: is the URL of ourksvc$IP_ADDRESS: is the Istio Ingress Gateway that we created in the previous step/api/hello: is the URI of our REST Controller that we created in our sample Spring Boot Application
Magically, we will get a response like :
Hello Nebrass ! it's 1574799175389
🤩🥳🤩🥳 WaaaaaYY 🤩🥳🤩🥳
behind the scenes - how things work ?
Our application is served by the KNative Serving component (wow obviously 😅).. so let’s go deep in the KNative Serving.
Let’s start with some theories 🤓 This definitions👇👇 are grabbed from the official Knative documentation 👇👇 I made some modificatiosn
Knative Serving defines a set of objects as Kubernetes Custom Resource Definitions (CRDs). These objects are used to define and control how your serverless workload behaves on the cluster:
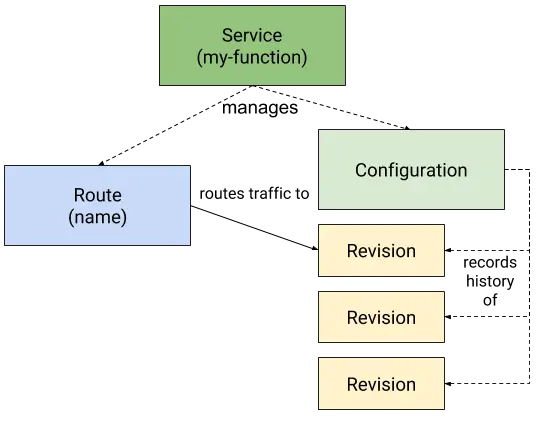
- Service: The
service.serving.knative.devresource automatically manages the whole lifecycle of your workload. It controls the creation of other objects to ensure that your app has a route, a configuration, and a new revision for each update of the service. Service can be defined to always route traffic to the latest revision or to a pinned revision. - Route: The
route.serving.knative.devresource maps a network endpoint to one or more revisions. You can manage the traffic in several ways, including fractional traffic and named Routes. - Configuration: The
configuration.serving.knative.devresource maintains the desired state for your deployment. It provides a clean separation between code and configuration and follows the 12Factor App methodology. Modifying a configuration creates a new revision. This is a very big point in KNative: REVISIONS ARE IMMUTABLE. - Revision: The
revision.serving.knative.devresource is a point-in-time snapshot of the code and configuration for each modification made to the workload. AGAIN: Revisions are immutable objects and can be retained for as long as useful. Knative Serving Revisions can be automatically scaled up and down according to incoming traffic.
 Knative Serving diagram
This is the theory, but what’s happening in our case ? 😁
The Knative Serving diagram of our use case his:
 The Knative Serving Ecosystem for our use case
What’s this Autoscaler and Activator? 😱😱
The Autoscaler & Activator are the two main components used by Knative to:
- handle elasticity of Pods to handle the high load of requests
- scale down to zero when there is not active request 😁 Don’t forget, the idea behind the Serverless is to have no active resource in the IDLE status 🤑
The Autoscaler & Activator appear in the cluster as Pods running in the knative-serving namespace:
- The Autoscaler collects information about the number of concurrent requests to a Revision, through a container called the
queue-proxyrunning inside the Revision’s Pod that already runs an other container calleduser-providedwhich is ourspring-knative-applicationimage. The Autoscaler, based on the number of requests, will increase or decrease the number of desired replicas in the Revision related Deployment. - The Activator is a component that receives all the traffic coming to the IDLE Revisions. When the Activator receives a request, it changes the Revision state to Active, which lets the Revision Pods receive the requests.
Playing with Logs, metrics and traces on Knative
Knative logs
In the KNative world, we have a (very) common Kubernetes logging pattern offered by the EFK brothers 😁 no, seriously, no it’s the EFK Band 🤩
- Elasticsearch is a distributed, RESTful search and analytics engine.
- Fluentd is an Logs collector - alternative for Logstash and more suitable for Containers.
- Kibana most used Elasticsearch data visualization engine.
Cool ! But we need to enable the EFK Logging in our KNative cluster: To do that we need to some configuration and some installations.
We need to edit the
config-observabilityConfigMap stored in theknative-servingNamespace:1$ kubectl edit cm -n knative-serving config-observabilityNow, under the
datasection add this entry:1 2 3 4 5 6logging.request-log-template: '{"httpRequest": {"requestMethod": "{{.Request.Method}}", "requestUrl": "{{js .Request.RequestURI}}", "requestSize": "{{.Request.ContentLength}}", "status": {{.Response.Code}}, "responseSize": "{{.Response.Size}}", "userAgent": "{{js .Request.UserAgent}}", "remoteIp": "{{js .Request.RemoteAddr}}", "serverIp": "{{.Revision.PodIP}}", "referer": "{{js .Request.Referer}}", "latency": "{{.Response.Latency}}s", "protocol": "{{.Request.Proto}}"}, "traceId": "{{index .Request.Header "X-B3-Traceid"}}"}'Be careful about the spaces, the ConfigMap will look like:
1 2 3 4 5 6 7 8 9 10 11 12 13 14 15 16 17 18 19 20 21 22apiVersion: v1 data: ... logging.request-log-template: '{"httpRequest": {"requestMethod": "{{.Request.Method}}", "requestUrl": "{{js .Request.RequestURI}}", "requestSize": "{{.Request.ContentLength}}", "status": {{.Response.Code}}, "responseSize": "{{.Response.Size}}", "userAgent": "{{js .Request.UserAgent}}", "remoteIp": "{{js .Request.RemoteAddr}}", "serverIp": "{{.Revision.PodIP}}", "referer": "{{js .Request.Referer}}", "latency": "{{.Response.Latency}}s", "protocol": "{{.Request.Proto}}"}, "traceId": "{{index .Request.Header "X-B3-Traceid"}}"}' kind: ConfigMap metadata: annotations: kubectl.kubernetes.io/last-applied-configuration: | {"apiVersion":"v1","data":{"_example":"... creationTimestamp: "2019-11-27T13:53:51Z" labels: serving.knative.dev/release: v0.10.0 name: config-observability namespace: knative-serving resourceVersion: "5058" selfLink: /api/v1/namespaces/knative-serving/configmaps/config-observability uid: 57a86288-111d-11ea-ba80-2659da8acb87Install the ELK Stack:
1$ kubectl apply --filename https://github.com/knative/serving/releases/download/v0.10.0/monitoring-logs-elasticsearch.yamlBefore going to the next steps, verify that all the pods are running:
1$ kubectl get pods --namespace knative-monitoring --watchWe need to to ensure that the Fluentd DaemonSet runs on all our nodes via labeling the nodes with the
beta.kubernetes.io/fluentd-ds-ready=truelabel:1$ kubectl label nodes --all beta.kubernetes.io/fluentd-ds-ready="true"Run the following command to ensure that the
fluentd-dsDaemonSet is ready on at least one node:1$ kubectl get daemonset fluentd-ds --namespace knative-monitoring --watchNow, we will start a local Kubernetes proxy:
1$ kubectl proxyNext, access the Kibana via the URL: http://localhost:8001/api/v1/namespaces/knative-monitoring/services/kibana-logging/proxy/app/kibana
Now, the first step is the configure an index pattern:
- Index pattern:
logstash-* - Time Filter field name:
@timestamp
 Kibana - Create index pattern
- Index pattern:
Now, click on the Discover menu, and in the search menu, we will enter the name of our KNative Service:
spring-knative-application Kibana - Searching KNative Service logging
Have fun ! 🥳😍🤩
Knative metrics
On KNative, we access metrics through the Grafana UI, which is the visualization tool for Prometheus.
⚠️ If you are not used to Grafana and Prometheus, I highly recommend this great free course 😎 Nowadays, mastering Grafana and Prometheus is a highly recommended skill for any Kubernetes professional.
https://www.youtube.com/watch?v=bErGEHf6GCc&list=PLpbcUe4chE7-HuslXKj1MB10ncorfzEGa
To open the KNative Grafana UI, enter the following command:
| |
Now, the Grafana UI is reachable via the URL: http://localhost:3000:
 Grafana UI: Knative Serving - Control Plane Efficiency dashboard
The following dashboards are pre-installed with KNative Serving:
- Revision HTTP Requests: HTTP request count, latency, and size metrics per revision and per configuration
- Nodes: CPU, memory, network, and disk metrics at node level
- Pods: CPU, memory, and network metrics at pod level
- Deployment: CPU, memory, and network metrics aggregated at deployment level
- Istio, Mixer and Pilot: Detailed Istio mesh, Mixer, and Pilot metrics
- Kubernetes: Dashboards giving insights into cluster health, deployments, and capacity usage
If you are used to play with Prometheus, keep calm, you will find always your toy. To access Prometheus, run this command:
| |
Next, access the Prometheus UI via the URL: http://localhost:9090
 Prometheus UI: sample
 http_request_duration_microseconds graph
Enjoy ! 🥳
Knative Request Tracing
We need to enable the support of Zipkin - I will be using Zipkin with in-memory database:
| |
Next, before accessing the Zipkin UI, start local proxy:
| |
Next, access the Zipkin UI via the URL: http://localhost:8001/api/v1/namespaces/istio-system/services/zipkin:9411/proxy/zipkin/
Now, click “Find Traces” to see the latest traces.
 Zipkin UI: KNative
 ksvc requests traces
To load the requests traces on our KService, just choose:
- istio-ingressgateway as Service Name
- spring-knative-application-something as Span Name 👉 which is the only instance of our KNative, in case of high load you will find many instances of our
ksvc
Click Find Traces to load all the gathered traces.
If you check the loaded traces, you can notice that the first request took 4 seconds to be handled, not like all the others that took only some milliseconds only. These traces can demonstrate the heavy cost of the first request. 😁
Where is The knative eventing ? 😁
COMING SOON !